
Page 133 - Fundamentals of Water Treatment Unit Processes : Physical, Chemical, and Biological
P. 133
88 Fundamentals of Water Treatment Unit Processes: Physical, Chemical, and Biological
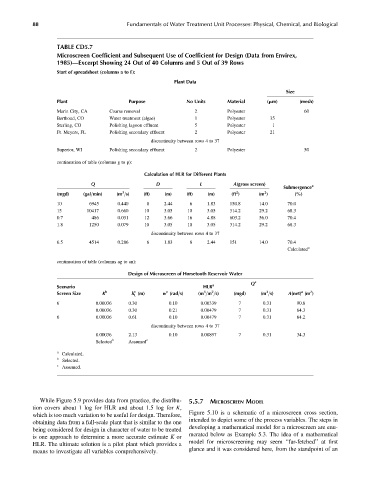
TABLE CD5.7
Microscreen Coefficient and Subsequent Use of Coefficient for Design (Data from Envirex,
1985)—Excerpt Showing 24 Out of 40 Columns and 5 Out of 39 Rows
Start of spreadsheet (columns a to f ):
Plant Data
Size
Plant Purpose No Units Material (mm) (mesh)
Marin City, CA Coarse removal 2 Polyester 60
Berthoud, CO Water treatment (algae) 1 Polyester 35
Sterling, CO Polishing lagoon effluent 5 Polyester 1
Ft. Meyers, FL Polishing secondary effluent 2 Polyester 21
discontinuity between rows 4 to 37
Superior, WI Polishing secondary effluent 2 Polyester 50
continuation of table (columns g to p):
Calculation of HLR for Different Plants
Q D L A(gross screen)
Submergence a
3
2
2
(mgd) (gal=min) (m =s) (ft) (m) (ft) (m) (ft ) (m ) (%)
10 6945 0.440 8 2.44 6 1.83 150.8 14.0 70.0
15 10417 0.660 10 3.05 10 3.05 314.2 29.2 68.3
0.7 486 0.031 12 3.66 16 4.88 603.2 56.0 70.4
1.8 1250 0.079 10 3.05 10 3.05 314.2 29.2 68.3
discontinuity between rows 4 to 37
6.5 4514 0.286 6 1.83 8 2.44 151 14.0 70.4
Calculated a
continuation of table (columns ag to an):
Design of Microscreen of Horsetooth Reservoir Water
Scenario HLR a Q c
3
3
c
2
c
a
2
Screen Size K b h (m) w (rad=s) (m =m =s) (mgd) (m =s) A(net) (m )
L
6 0.00036 0.30 0.10 0.00339 7 0.31 90.8
0.00036 0.30 0.21 0.00479 7 0.31 64.3
6 0.00036 0.61 0.10 0.00479 7 0.31 64.2
discontinuity between rows 4 to 37
0.00036 2.13 0.10 0.00897 7 0.31 34.3
Selected b Assumed c
a
Calculated.
b
Selected.
c
Assumed.
While Figure 5.9 provides data from practice, the distribu- 5.5.7 MICROSCREEN MODEL
tion covers about 1 log for HLR and about 1.5 log for K,
Figure 5.10 is a schematic of a microscreen cross section,
which is too much variation to be useful for design. Therefore,
intended to depict some of the process variables. The steps in
obtaining data from a full-scale plant that is similar to the one
developing a mathematical model for a microscreen are enu-
being considered for design in character of water to be treated
merated below as Example 5.3. The idea of a mathematical
is one approach to determine a more accurate estimate K or
model for microscreening may seem ‘‘far-fetched’’ at first
HLR. The ultimate solution is a pilot plant which provides a
glance and it was considered here, from the standpoint of an
means to investigate all variables comprehensively.