
Page 132 - Fundamentals of Water Treatment Unit Processes : Physical, Chemical, and Biological
P. 132
Screening 87
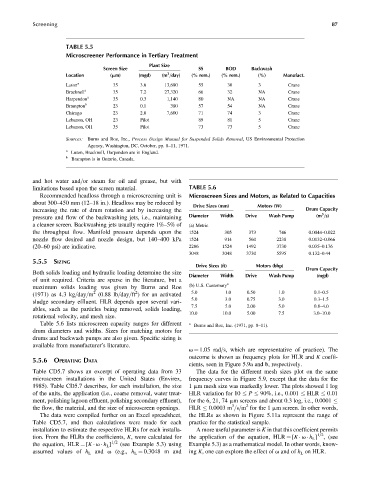
TABLE 5.5
Microscreener Performance in Tertiary Treatment
Plant Size
Screen Size SS BOD Backwash
3
Location (mm) (mgd) (m =day) (% rem.) (% rem.) (%) Manufact.
Luton a 35 3.6 13,680 55 30 3 Crane
Bracknell a 35 7.2 27,320 66 32 NA Crane
Harpendon a 35 0.3 1,140 80 NA NA Crane
Brampton b 23 0.1 380 57 54 NA Crane
Chicago 23 2.0 7,600 71 74 3 Crane
Lebanon, OH 23 Pilot 89 81 5 Crane
Lebanon, OH 35 Pilot 73 73 5 Crane
Sources: Burns and Roe, Inc., Process Design Manual for Suspended Solids Removal, US Environmental Protection
Agency, Washington, DC, October, pp. 8–11, 1971.
a
Luton, Bracknell, Harpendon are in England.
b
Brampton is in Ontario, Canada.
and hot water and=or steam for oil and grease, but with
limitations based upon the screen material. TABLE 5.6
Recommended headloss through a microscreening unit is Microscreen Sizes and Motors, as Related to Capacities
about 300–450 mm (12–18 in.). Headloss may be reduced by
Drive Sizes (mm) Motors (W)
increasing the rate of drum rotation and by increasing the Drum Capacity
3
pressure and flow of the backwashing jets, i.e., maintaining Diameter Width Drive Wash Pump (m =s)
a cleaner screen. Backwashing jets usually require 1%–5% of (a) Metric
the throughput flow. Manifold pressure depends upon the 1524 305 373 746 0.0044–0.022
nozzle flow desired and nozzle design, but 140–400 kPa 1524 914 560 2238 0.0132–0.066
(20–60 psi) are indicative. 2286 1524 1492 3730 0.035–0.176
3048 3048 3730 5595 0.132–0.44
5.5.5 SIZING
Drive Sizes (ft) Motors (bhp)
Drum Capacity
Both solids loading and hydraulic loading determine the size
Diameter Width Drive Wash Pump (mgd)
of unit required. Criteria are sparse in the literature, but a a
maximum solids loading was given by Burns and Roe (b) U.S. Customary
2
2
(1971) as 4.3 kg=day=m (0.88 lb=day=ft ) for an activated 5.0 1.0 0.50 1.0 0.1–0.5
5.0 3.0 0.75 3.0 0.3–1.5
sludge secondary effluent. HLR depends upon several vari-
7.5 5.0 2.00 5.0 0.8–4.0
ables, such as the particles being removed, solids loading,
10.0 10.0 5.00 7.5 3.0–10.0
rotational velocity, and mesh size.
Table 5.6 lists microscreen capacity ranges for different a Burns and Roe, Inc. (1971, pp. 8–11).
drum diameters and widths. Sizes for matching motors for
drums and backwash pumps are also given. Specific sizing is
available from manufacturer’s literature.
v ¼ 1.05 rad=s, which are representative of practice). The
outcome is shown as frequency plots for HLR and K coeffi-
5.5.6 OPERATING DATA
cients, seen in Figure 5.9a and b, respectively.
Table CD5.7 shows an excerpt of operating data from 33 The data for the different mesh sizes plot on the same
microscreen installations in the United States (Envirex, frequency curves in Figure 5.9, except that the data for the
1985). Table CD5.7 describes, for each installation, the size 1 mm mesh size was markedly lower. The plots showed 1 log
of the units, the application (i.e., coarse removal, water treat- HLR variation for 10 P 90%, i.e., 0.001 HLR 0.01
ment, polishing lagoon effluent, polishing secondary effluent), for the 6, 21, 74 mm screens and about 0.3 log, i.e., 0.0001
2
3
the flow, the material, and the size of microscreen openings. HLR 0.0003 m =s=m for the 1 mm screen. In other words,
The data were compiled further on an Excel spreadsheet, the HLRs as shown in Figure 5.11a represent the range of
Table CD5.7, and then calculations were made for each practice for the statistical sample.
installation to estimate the respective HLRs for each installa- A more useful parameter is K in that this coefficient permits
tion. From the HLRs the coefficients, K, were calculated for the application of the equation, HLR ¼ [K v h L ] 1=2 , (see
the equation, HLR ¼ [K v h L ] 1=2 (see Example 5.3) using Example 5.3) as a mathematical model. In other words, know-
assumed values of h L and v (e.g., h L ¼ 0.3048 m and ing K, one can explore the effect of v and of h L on HLR.