
Page 144 - Fundamentals of Water Treatment Unit Processes : Physical, Chemical, and Biological
P. 144
Sedimentation 99
3
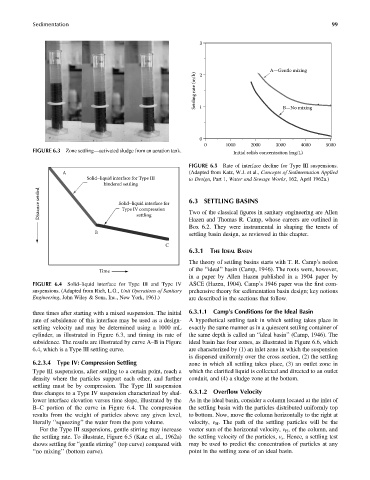
A—Gentle mixing
Settling rate (m/h) 1 B—No mixing
2
0
0 1000 2000 3000 4000 5000
FIGURE 6.3 Zone settling—activated sludge from an aeration tank.
Initial solids concentration (mg/L)
FIGURE 6.5 Rate of interface decline for Type III suspensions.
A (Adapted from Katz, W.J. et al., Concepts of Sedimentation Applied
Solid–liquid interface for Type III to Design, Part 1, Water and Sewage Works, 162, April 1962a.)
hindered settling
Distance settled Solid–liquid interface for 6.3 SETTLING BASINS
Type IV compression
Two of the classical figures in sanitary engineering are Allen
settling
Hazen and Thomas R. Camp, whose careers are outlined in
Box 6.2. They were instrumental in shaping the tenets of
B
settling basin design, as reviewed in this chapter.
C
6.3.1 THE IDEAL BASIN
The theory of settling basins starts with T. R. Camp’s notion
Time of the ‘‘ideal’’ basin (Camp, 1946). The roots were, however,
in a paper by Allen Hazen published in a 1904 paper by
FIGURE 6.4 Solid–liquid interface for Type III and Type IV ASCE (Hazen, 1904). Camp’s 1946 paper was the first com-
suspensions. (Adapted from Rich, L.G., Unit Operations of Sanitary prehensive theory for sedimentation basin design; key notions
Engineering, John Wiley & Sons, Inc., New York, 1961.) are described in the sections that follow.
three times after starting with a mixed suspension. The initial 6.3.1.1 Camp’s Conditions for the Ideal Basin
rate of subsidence of this interface may be used as a design- A hypothetical settling tank in which settling takes place in
settling velocity and may be determined using a 1000 mL exactly the same manner as in a quiescent settling container of
cylinder, as illustrated in Figure 6.3, and timing its rate of the same depth is called an ‘‘ideal basin’’ (Camp, 1946). The
subsidence. The results are illustrated by curve A–B in Figure ideal basin has four zones, as illustrated in Figure 6.6, which
6.4, which is a Type III settling curve. are characterized by (1) an inlet zone in which the suspension
is dispersed uniformly over the cross section, (2) the settling
6.2.3.4 Type IV: Compression Settling zone in which all settling takes place, (3) an outlet zone in
Type III suspensions, after settling to a certain point, reach a which the clarified liquid is collected and directed to an outlet
density where the particles support each other, and further conduit, and (4) a sludge zone at the bottom.
settling must be by compression. The Type III suspension
thus changes to a Type IV suspension characterized by shal- 6.3.1.2 Overflow Velocity
lower interface elevation versus time slope, illustrated by the As in the ideal basin, consider a column located at the inlet of
B–C portion of the curve in Figure 6.4. The compression the settling basin with the particles distributed uniformly top
results from the weight of particles above any given level, to bottom. Now, move the column horizontally to the right at
literally ‘‘squeezing’’ the water from the pore volume. velocity, v H . The path of the settling particles will be the
For the Type III suspensions, gentle stirring may increase vector sum of the horizontal velocity, v H , of the column, and
the settling rate. To illustrate, Figure 6.5 (Katz et al., 1962a) the settling velocity of the particles, v s . Hence, a settling test
shows settling for ‘‘gentle stirring’’ (top curve) compared with may be used to predict the concentration of particles at any
‘‘no mixing’’ (bottom curve). point in the settling zone of an ideal basin.