
Page 215 - Fundamentals of Water Treatment Unit Processes : Physical, Chemical, and Biological
P. 215
170 Fundamentals of Water Treatment Unit Processes: Physical, Chemical, and Biological
8.3.2.2 Bubble Size 40
Number of bubbles=279
Bubble size decreases with increasing saturator pressure and 35 Bubbles =150 μm=3.2%
with increasing flow, as illustrated by the experimental data of 30
Figure 8.5. In the ‘‘recommended practice’’ range, i.e., 400–
600 kPa gage, the bubbles were in an acceptable size range, 25
i.e., 40–60 mm. The pressure change was across a needle Number of bubbles 20
valve with three experimental flows. 15
The merits of the small bubble size include (de Rijk et al.,
1994, p. 467) (1) small bubbles attach to floc more easily; 10
(2) the floc–bubble collision probability is proportional to the 5
bubble number concentration, not bubble size; and (3) small
0
bubbles have a lower rise velocity giving a longer residence 0 10 15 20 25 30 35 40 45 50 55 60 65 70 75 80 85 90 95 100 110 120 130 140 150
time in the contact zone.
Bubble size (μm)
Bubble sizes larger than 150 mm diameter are called
‘‘macro-bubbles’’ (Rykaart and Haarhoff, 1995). They impair
FIGURE 8.6 Frequency distribution of bubble sizes from photo-
the flotation process by hindering interaction between floc and
micrograph. (Adapted from Haarhoff, J., Factors Influencing Bubble
microbubbles; also, they rise rapidly, causing a turbulent Formation in Dissolved Air Flotation, International Association of
wake, and they are likely to disrupt the float layer. Water Quality Yearbook, 1994–95, 1995.)
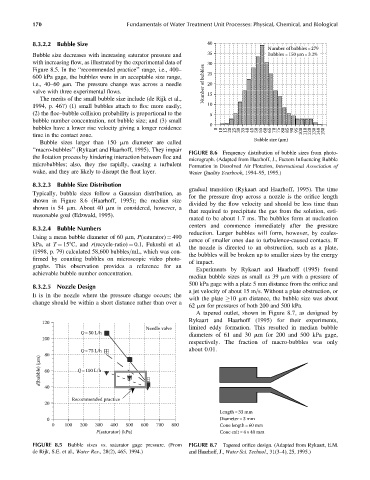
8.3.2.3 Bubble Size Distribution
gradual transition (Rykaart and Haarhoff, 1995). The time
Typically, bubble sizes follow a Gaussian distribution, as
for the pressure drop across a nozzle is the orifice length
shown in Figure 8.6 (Haarhoff, 1995); the median size
divided by the flow velocity and should be less time than
shown is 54 mm. About 40 mm is considered, however, a
that required to precipitate the gas from the solution, esti-
reasonable goal (Edzwald, 1995).
mated to be about 1.7 ms. The bubbles form at nucleation
centers and commence immediately after the pressure
8.3.2.4 Bubble Numbers
reduction. Larger bubbles will form, however, by coales-
Using a mean bubble diameter of 60 mm, P(saturator) ¼ 490
cence of smaller ones due to turbulence-caused contacts. If
kPa, at T ¼ 158C, and r(recycle-ratio) ¼ 0.1, Fukushi et al.
the nozzle is directed to an obstruction, such as a plate,
(1998, p. 79) calculated 58,600 bubbles=mL, which was con-
the bubbles will be broken up to smaller sizes by the energy
firmed by counting bubbles on microscopic video photo-
of impact.
graphs. This observation provides a reference for an
Experiments by Rykaart and Haarhoff (1995) found
achievable bubble number concentration.
median bubble sizes as small as 39 mm with a pressure of
500 kPa gage with a plate 5 mm distance from the orifice and
8.3.2.5 Nozzle Design
a jet velocity of about 15 m=s. Without a plate obstruction, or
It is in the nozzle where the pressure change occurs; the
with the plate 10 mm distance, the bubble size was about
change should be within a short distance rather than over a
62 mm for pressures of both 200 and 500 kPa.
A tapered outlet, shown in Figure 8.7, as designed by
Rykaart and Haarhoff (1995) for their experiments,
120
Needle valve limited eddy formation. This resulted in median bubble
Q =50 L/h diameters of 61 and 30 mm for 200 and 500 kPa gage,
100
respectively. The fraction of macro-bubbles was only
Q =75 L/h about 0.01.
80
d(bubble) (μm) 60 Q =100 L/h
40
Recommended practice
20
Length=33 mm
0 Diameter=3 mm
0 100 200 300 400 500 600 700 800 Cone length =60 mm
P(saturator) (kPa) Cone exit=4×40 mm
FIGURE 8.5 Bubble sizes vs. saturator gage pressure. (From FIGURE 8.7 Tapered orifice design. (Adapted from Rykaart, E.M.
de Rijk, S.E. et al., Water Res., 28(2), 465, 1994.) and Haarhoff, J., Water Sci. Technol., 31(3–4), 25, 1995.)