
Page 225 - Fundamentals of Water Treatment Unit Processes : Physical, Chemical, and Biological
P. 225
180 Fundamentals of Water Treatment Unit Processes: Physical, Chemical, and Biological
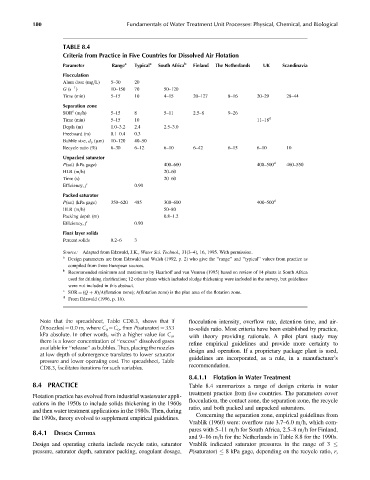
TABLE 8.4
Criteria from Practice in Five Countries for Dissolved Air Flotation
Parameter Range a Typical a South Africa b Finland The Netherlands UK Scandinavia
Flocculation
Alum dose (mg=L) 5–30 20
1
G (s ) 10–150 70 50–120
Time (min) 5–15 10 4–15 20–127 8–16 20–29 28–44
Separation zone
c
SOR (m=h) 5–15 8 5–11 2.5–8 9–26
Time (min) 5–15 10 11–18 d
Depth (m) 1.0–3.2 2.4 2.5–3.0
Freeboard (m) 0.1–0.4 0.3
Bubble size, d p (mm) 10–120 40–50
Recycle ratio (%) 6–30 6–12 6–10 6–42 6–15 6–10 10
Unpacked saturator
d
P(sat) (kPa gage) 400–600 400–500 460–550
HLR (m=h) 20–60
Time (s) 20–60
Efficiency, f 0.90
Packed saturator
d
P(sat) (kPa gage) 350–620 485 300–600 400–500
HLR (m=h) 50–80
Packing depth (m) 0.8–1.2
Efficiency, f 0.90
Float layer solids
Percent solids 0.2–6 3
Source: Adapted from Edzwald, J.K., Water Sci. Technol., 31(3–4), 16, 1995. With permission.
a
Design parameters are from Edzwald and Walsh (1992, p. 2) who give the ‘‘range’’ and ‘‘typical’’ values from practice as
compiled from three European sources.
b
Recommended minimum and maximums by Haarhoff and van Vuuren (1995) based on review of 14 plants in South Africa
used for drinking clarification; 12 other plants which included sludge thickening were included in the survey, but guidelines
were not included in this abstract.
c
SOR ¼ (Q þ R)=A(flotation zone); A(flotation zone) is the plan area of the flotation zone.
d
From Edzwald (1996, p. 16).
Note that the spreadsheet, Table CD8.3, shows that if flocculation intensity, overflow rate, detention time, and air-
D(nozzles) ¼ 0.0 m, where C a ¼ C o ,then P(saturator) ¼ 353 to-solids ratio. Most criteria have been established by practice,
kPa absolute. In other words, with a higher value for C a , with theory providing rationale. A pilot plant study may
there is a lower concentration of ‘‘excess’’ dissolved gases
refine empirical guidelines and provide more certainty to
available for ‘‘release’’ as bubbles. Thus, placing the nozzles
design and operation. If a proprietary package plant is used,
at low depth of submergence translates to lower saturator
guidelines are incorporated, as a rule, in a manufacturer’s
pressure and lower operating cost. The spreadsheet, Table
CD8.3, facilitates iterations for such variables. recommendation.
8.4.1.1 Flotation in Water Treatment
8.4 PRACTICE Table 8.4 summarizes a range of design criteria in water
treatment practice from five countries. The parameters cover
Flotation practice has evolved from industrial wastewater appli-
flocculation, the contact zone, the separation zone, the recycle
cations in the 1950s to include solids thickening in the 1960s
ratio, and both packed and unpacked saturators.
and then water treatment applications in the 1980s. Then, during
Concerning the separation zone, empirical guidelines from
the 1990s, theory evolved to supplement empirical guidelines.
Vrablik (1960) were: overflow rate 3.7–6.0 m=h, which com-
pares with 5–11 m=h for South Africa, 2.5–8m=h for Finland,
8.4.1 DESIGN CRITERIA
and 9–16 m=h for the Netherlands in Table 8.8 for the 1990s.
Design and operating criteria include recycle ratio, saturator Vrablik indicated saturator pressures in the range of 3
pressure, saturator depth, saturator packing, coagulant dosage, P(saturator) 8 kPa gage, depending on the recycle ratio, r,