
Page 379 - Fundamentals of Water Treatment Unit Processes : Physical, Chemical, and Biological
P. 379
334 Fundamentals of Water Treatment Unit Processes: Physical, Chemical, and Biological
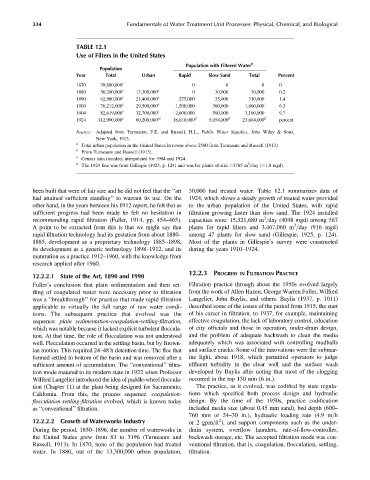
TABLE 12.1
Use of Filters in the United States
Population with Filtered Water b
Population
Year Total Urban Rapid Slow Sand Total Percent
1870 39,800,000 c 0 0 0 0
1880 50,200,000 c 13,300,000 a 0 30,000 30,000 0.2
1890 62,980,000 c 21,400,000 a 275,000 35,000 310,000 1.4
1900 76,212,000 c 29,500,000 a 1,500,000 360,000 1,860,000 6.3
c c
1904 82,619,000 32,700,000 2,600,000 560,000 3,160,000 9.7
1924 112,900,000 c 60,200,000 ac 18,610,000 d 5,054,000 d 23,664,000 d percent
Source: Adapted from Turneaure, F.E. and Russell, H.L., Public Water Supplies, John Wiley & Sons,
New York, 1913.
a
Total urban population in the United States in towns above 2500 from Turneaure and Russell (1913).
b
From Turneaure and Russell (1913).
c
Census data rounded; interpolated for 1904 and 1924.
d 3
The 1924 line was from Gillespie (1925, p. 124) and was for plants of size 3785 m =day ( 1.0 mgd).
been built that were of fair size and he did not feel that the ‘‘art 30,000 had treated water. Table 12.1 summarizes data of
had attained sufficient standing’’ to warrant its use. On the 1924, which shows a steady growth of treated water provided
other hand, in the years between his 1912 report, he felt that as to the urban population of the United States, with rapid
sufficient progress had been made he felt no hesitation in filtration growing faster than slow sand. The 1924 installed
3
recommending rapid filtration (Fuller, 1914, pp. 454–465). capacities were: 15,321,680 m =day (4048 mgd) among 587
3
A point to be extracted from this is that we might say that plants for rapid filters and 3,467,060 m =day (916 mgd)
rapid filtration technology had its gestation from about 1880– among 47 plants for slow sand (Gillespie, 1925, p. 124).
1885, development as a proprietary technology 1885–1898, Most of the plants in Gillespie’s survey were constructed
its development as a generic technology 1898–1912, and its during the years 1910–1924.
maturation as a practice 1912–1960, with the knowledge from
research applied after 1960.
12.2.3 PROGRESS IN FILTRATION PRACTICE
12.2.2.1 State of the Art, 1890 and 1990
Fuller’s conclusion that plain sedimentation and then set- Filtration practice through about the 1950s evolved largely
tling of coagulated water were necessary prior to filtration from the work of Allen Hazen, George Warren Fuller, Wilfred
was a ‘‘breakthrough’’ for practice that made rapid filtration Langelier, John Baylis, and others. Baylis (1937, p. 1011)
applicable to virtually the full range of raw water condi- described some of the issues of the period from 1915, the start
tions. The subsequent practice that evolved was the of his career in filtration, to 1937, for example, maintaining
sequence: plain sedimentation-coagulation-settling-filtration, effective coagulation, the lack of laboratory control, education
which was notable because it lacked explicit turbulent floccula- of city officials and those in operation, under-drain design,
tion. At that time, the role of flocculation was not understood and the problem of adequate backwash to clean the media
well. Flocculation occurred in the settling basin, but by Brown- adequately which was associated with controlling mudballs
ian motion. This required 24–48 h detention time. The floc that and surface cracks. Some of the innovations were the submar-
formed settled to bottom of the basin and was removed after a ine light, about 1918, which permitted operators to judge
sufficient amount of accumulation. The ‘‘conventional’’ filtra- effluent turbidity in the clear well and the surface wash
tion mode matured to its modern state in 1922 when Professor developed by Baylis after noting that most of the clogging
Wilfred Langelier introduced the idea of paddle-wheel floccula- occurred in the top 150 mm (6 in.).
tion (Chapter 11) at the plant being designed for Sacramento, The practice, as it evolved, was codified by state regula-
California. From this, the process sequence: coagulation- tions which specified both process design and hydraulic
flocculation-settling-filtration evolved, which is known today design. By the time of the 1950s, practice codification
as ‘‘conventional’’ filtration. included media size (about 0.45 mm sand), bed depth (600–
760 mm or 24–30 in.), hydraulic loading rate (4.9 m=h
2
12.2.2.2 Growth of Waterworks Industry or 2 gpm=ft ), and support components such as the under-
During the period, 1850–1896, the number of waterworks in drain system, overflow launders, rate-of-flow-controller,
the United States grew from 83 to 3196 (Turneaure and backwash storage, etc. The accepted filtration mode was con-
Russell, 1913). In 1870, none of the population had treated ventional filtration, that is, coagulation, flocculation, settling,
water. In 1880, out of the 13,300,000 urban population, filtration.