
Page 382 - Fundamentals of Water Treatment Unit Processes : Physical, Chemical, and Biological
P. 382
Rapid Filtration 337
1. The C(Z) t 0 curve has exponential decline with horizontal axis on the left; and time, t (minutes), is the second
distance (per Iwasaki’s Equation 12.12). horizontal axis on the right. The C(Z, t) plot was the result
2. The C(Z) t>0 curves may show a steeper exponential of model simulation by Ives (1962) and gives an overall
decline due to ‘‘ripening.’’ perspective to the same results seen in the C(Z) t plot.
3. When the upper layer becomes ‘‘saturated’’ with
solids, the C(Z) t 0 curve takes a steady state shape. 12.3.2.4 Mass Transfer Similarities between
4. At about t ¼ 55 h the steady state wave front trans- Adsorption and Filtration
lates at a velocity, v wf 0.156 cm=h. The filtration process falls within a class of packed bed reactor
curve is defined as the wave front that problems involving both materials balance and similar kinet-
5. The C(t) Z¼Z o
emerges from the bottom of the filter at Z ¼ Z o . ics, for example, granular activated carbon and ion exchange
(Vagliasindi and Hendricks, 1992; Adin and Rebhun, 1977;
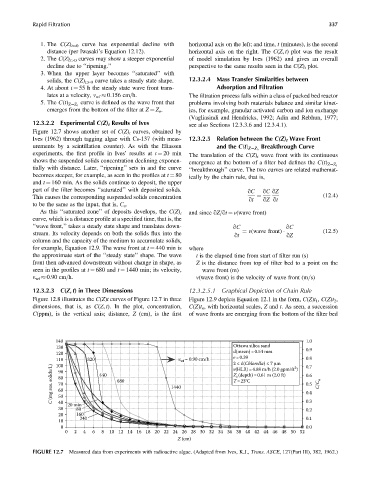
12.3.2.2 Experimental C(Z) t Results of Ives see also Sections 12.3.3.6 and 12.3.4.1).
Figure 12.7 shows another set of C(Z) t curves, obtained by
Ives (1962) through tagging algae with Cs-137 (with meas- 12.3.2.5 Relation between the C(Z) t Wave Front
urements by a scintillation counter). As with the Eliassen Breakthrough Curve
and the C(t) Z¼Z o
experiments, the first profile in Ives’ results at t ¼ 20 min The translation of the C(Z) t wave front with its continuous
shows the suspended solids concentration declining exponen- emergence at the bottom of a filter bed defines the C(t)
Z¼Z o
tially with distance. Later, ‘‘ripening’’ sets in and the curve ‘‘breakthrough’’ curve. The two curves are related mathemat-
becomes steeper, for example, as seen in the profiles at t ¼ 80 ically by the chain rule, that is,
and t ¼ 160 min. As the solids continue to deposit, the upper
part of the filter becomes ‘‘saturated’’ with deposited solids. qC qC qZ
This causes the corresponding suspended solids concentration ¼ (12:4)
qt qZ qt
to be the same as the input, that is, C o .
As this ‘‘saturated zone’’ of deposits develops, the C(Z) t and since qZ=qt ¼ v(wave front)
curve, which is a distance profile at a specified time, that is, the
‘‘wave front,’’ takes a steady state shape and translates down- qC qC
stream. Its velocity depends on both the solids flux into the qt ¼ v(wave front) qZ (12:5)
column and the capacity of the medium to accumulate solids,
for example, Equation 12.9. The wave front at t ¼ 440 min is where
the approximate start of the ‘‘steady state’’ shape. The wave t is the elapsed time from start of filter run (s)
front then advanced downstream without change in shape, as Z is the distance from top of filter bed to a point on the
seen in the profiles at t ¼ 680 and t ¼ 1440 min; its velocity, wave front (m)
v wf 0.90 cm=h. v(wave front) is the velocity of wave front (m=s)
12.3.2.3 C(Z, t) in Three Dimensions 12.3.2.5.1 Graphical Depiction of Chain Rule
Figure 12.8 illustrates the C(Z)t curves of Figure 12.7 in three Figure 12.9 depicts Equation 12.1 in the form, C(Z)t 1 , C(Z)t 2 ,
dimensions, that is, as C(Z, t). In the plot, concentration, C(Z)t n , with horizontal scales, Z and t. As seen, a succession
C(ppm), is the vertical axis; distance, Z (cm), is the first of wave fronts are emerging from the bottom of the filter bed
140 1.0
130 Ottawa silica sand 0.9
120 d(mean)=0.54 mm
110 320 v = 0.90 cm/h e =0.39 2 0.8
wf
2 ≤ d(Chlorella) ≤ 7 μm
100
C (mg sus. solids/L) 80 440 680 1440 Z (depth)=0.61 m (2.0 ft) 0.6 C/C o
0.7
v(HLR) = 4.88 m/h (2.0 gpm/ft )
90
o
T=23°C
70
0.5
60
0.4
50
40
30 20 min 0.3
80
0.2
20 160
10 240 0.1
0 0.0
0 2 4 6 8 10 12 14 16 18 20 22 24 26 28 30 32 34 36 38 40 42 44 46 48 50 52
Z (cm)
FIGURE 12.7 Measured data from experiments with radioactive algae. (Adapted from Ives, K.J., Trans. ASCE, 127(Part III), 382, 1962.)