
Page 384 - Fundamentals of Water Treatment Unit Processes : Physical, Chemical, and Biological
P. 384
Rapid Filtration 339
Specific deposit (mL solids/mL filter volume) 0.08 0.08
0.07
0.07
0.06
0.06
0.05
0.05
0.04
0.04
0.03
0.03
0.02
0.02
0.01
0.01
0
330 0
280
0 260
220
5 180
150
10 110 Time (min)
Z (cm)
80
15 50
15
0
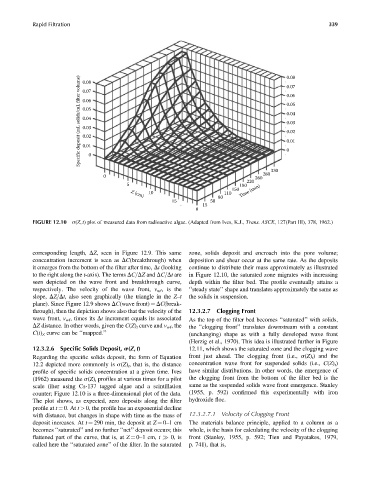
FIGURE 12.10 s(Z, t) plot of measured data from radioactive algae. (Adapted from Ives, K.J., Trans. ASCE, 127(Part III), 378, 1962.)
corresponding length, DZ, seen in Figure 12.9. This same zone, solids deposit and encroach into the pore volume;
concentration increment is seen as DC(breakthrough) when deposition and shear occur at the same rate. As the deposits
it emerges from the bottom of the filter after time, Dt (looking continue to distribute their mass approximately as illustrated
to the right along the t-axis). The terms DC=DZ and DC=Dt are in Figure 12.10, the saturated zone migrates with increasing
seen depicted on the wave front and breakthrough curve, depth within the filter bed. The profile eventually attains a
respectively. The velocity of the wave front, v wf , is the ‘‘steady state’’ shape and translates approximately the same as
slope, DZ=Dt, also seen graphically (the triangle in the Z–t the solids in suspension.
plane). Since Figure 12.9 shows DC(wave front) ¼ DC(break-
through), then the depiction shows also that the velocity of the 12.3.2.7 Clogging Front
wave front, v wf , times its Dt increment equals its associated As the top of the filter bed becomes ‘‘saturated’’ with solids,
DZ distance. In other words, given the C(Z) t curve and v wf , the the ‘‘clogging front’’ translates downstream with a constant
C(t) Z curve can be ‘‘mapped.’’ (unchanging) shape as with a fully developed wave front
(Herzig et al., 1970). This idea is illustrated further in Figure
12.3.2.6 Specific Solids Deposit, s(Z, t) 12.11, which shows the saturated zone and the clogging wave
Regarding the specific solids deposit, the form of Equation front just ahead. The clogging front (i.e., s(Z) t ) and the
12.2 depicted more commonly is s(Z) t , that is, the distance concentration wave front for suspended solids (i.e., C(Z) t )
profile of specific solids concentration at a given time. Ives have similar distributions. In other words, the emergence of
(1962) measured the s(Z) t profiles at various times for a pilot the clogging front from the bottom of the filter bed is the
scale filter using Cs-137 tagged algae and a scintillation same as the suspended solids wave front emergence. Stanley
counter; Figure 12.10 is a three-dimensional plot of the data. (1955, p. 592) confirmed this experimentally with iron
The plot shows, as expected, zero deposits along the filter hydroxide floc.
profile at t ¼ 0. At t > 0, the profile has an exponential decline
with distance, but changes in shape with time as the mass of 12.3.2.7.1 Velocity of Clogging Front
deposit increases. At t ¼ 290 min, the deposit at Z ¼ 0–1cm The materials balance principle, applied to a column as a
becomes ‘‘saturated’’ and no further ‘‘net’’ deposit occurs; this whole, is the basis for calculating the velocity of the clogging
flattened part of the curve, that is, at Z ¼ 0–1 cm, t 0, is front (Stanley, 1955, p. 592; Tien and Payatakes, 1979,
called here the ‘‘saturated zone’’ of the filter. In the saturated p. 741), that is,