
Page 389 - Fundamentals of Water Treatment Unit Processes : Physical, Chemical, and Biological
P. 389
344 Fundamentals of Water Treatment Unit Processes: Physical, Chemical, and Biological
(Amirtharajah, 1985). Hydraulic dispersion also plays a role 1. Materials balance: Equation 12.11 states that the
in each of these events. rate of accumulation of particles within an infinitesi-
mal slice of the filter bed, at depth, Z, equals the net
rate of advection of particles to and from the slice.
12.3.3 MATHEMATICAL MODELING
As a note, the relationship is for a ‘‘steady state’’
The starting point for mathematical modeling was a paper by condition, which means that the left side of Equation
Iwasaki (1937) which described the basic equations of the 12.11 is zero. The suspended solids concentration
filtration process. The work languished, however, until the changes with time, however, at any given Z,as
1950s when Ives commenced his research on filtration (see seen in Figures 12.8 through 12.10 and so a mass
Section 12.3.2.2). accumulation term, for example, Ve[qC=qZ] observed ,
Two other papers were notable in setting direction. First, should have been included in the left side of Equa-
O’Melia and Stumm (1967) delineated fundamental factors tion 12.11. This point is rectified in Equations 12.22
affecting particle collector attachment, a, that is, in terms of through 12.30, Section 12.3.3.6.
double-layer interactions and van der Waals forces, and the 2. Kinetics: Equation 12.12 states that the rate of
role of associated chemical factors. Second, Yao et al. (1971) removal of particles, with respect to filter depth,
described the transport coefficient, h. These studies were the qC=qZ, is proportional to the concentration, C. The
basis for more sophisticated mathematical models developed coefficient, l, is a measure of the probability of
during the 1970s and 1980s, reviewed in this section. removal of a particle per unit of filter bed depth.
The relation describes the beginning of the filtration
12.3.3.1 Iwasaki’s Equations cycle, that is, when the filter is ‘‘clean,’’ but is not
In 1936, Iwasaki published, ‘‘Some Notes on Sand Filtra- valid as the filtration cycle progresses due to ‘‘clog-
tion,’’ which proposed three equations to describe the removal ging’’ of pores with solids removed, which changes l.
of particles within a sand bed: The integrated form of Equation 12.12 is
qC 1 qs C
0 ¼ v þ (12:11) ¼ e lZ (12:14)
qZ e qt
C o
qC
¼ lC (12:12) with the equivalent natural log form
qZ
and C
ln ¼ lZ (12:15)
C o
l ¼ l 0 þ cs (12:13)
and the equivalent common log form
where
C is the mass concentration of suspended material in water
3
entering filter bed (kg suspended matter=m water) log C ¼ l Z (12:16)
Z is the depth from surface of filter (m) C o 2:3
l is the ‘‘local’’ filter coefficient at any depth and time
1
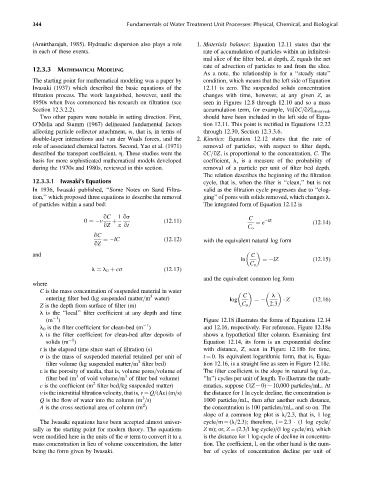
(m ) Figure 12.18 illustrates the forms of Equations 12.14
1
l 0 is the filter coefficient for clean-bed (m ) and 12.16, respectively. For reference, Figure 12.18a
l is the filter coefficient for clean-bed after deposits of shows a hypothetical filter column. Examining first
1
solids (m ) Equation 12.14, its form is an exponential decline
t is the elapsed time since start of filtration (s) with distance, Z, seen in Figure 12.18b for time,
s is the mass of suspended material retained per unit of t ¼ 0. Its equivalent logarithmic form, that is, Equa-
3
filter volume (kg suspended matter=m filter bed) tion 12.16, is a straight line as seen in Figure 12.18c.
e is the porosity of media, that is, volume pores=volume of The filter coefficient is the slope in natural log (i.e.,
3
3
filter bed (m of void volume=m of filter bed volume) ‘‘ln’’) cycles per unit of length. To illustrate the math-
2
c is the coefficient (m filter bed=kg suspended matter) ematics, suppose C(Z ¼ 0) ¼ 10,000 particles=mL. At
v is the interstitial filtration velocity, that is, v ¼ Q=(Ae)(m=s) the distance for 1 ln cycle decline, the concentration is
3
Q is the flow of water into the column (m =s) 1000 particles=mL, then after another such distance,
2
A is the cross sectional area of column (m ) the concentration is 100 particles=mL, and so on. The
slope of a common log plot is l=2.3, that is, 1 log
The Iwasaki equations have been accepted almost univer- cycle=m ¼ (l=2.3); therefore, l ¼ 2.3 (1 log cycle=
sally as the starting point for modern theory. The equations Z m); or, Z ¼ (2.3=l log cycle)=(l log cycle=m), which
were modified here in the units of the s term to convert it to a is the distance for 1 log-cycle of decline in concentra-
mass concentration in lieu of volume concentration, the latter tion. The coefficient, l, on the other hand is the num-
being the form given by Iwasaki. ber of cycles of concentration decline per unit of