
Page 385 - Fundamentals of Water Treatment Unit Processes : Physical, Chemical, and Biological
P. 385
340 Fundamentals of Water Treatment Unit Processes: Physical, Chemical, and Biological
QC o where
0 σ σ u t(sat) is the time associated with a given position of the
0
saturated zone, that is, Z(sat) (s)
Z(sat) is the distance along the column to the end of the
saturated zone (m)
s u is the maximum level of solids that may exist in the
3
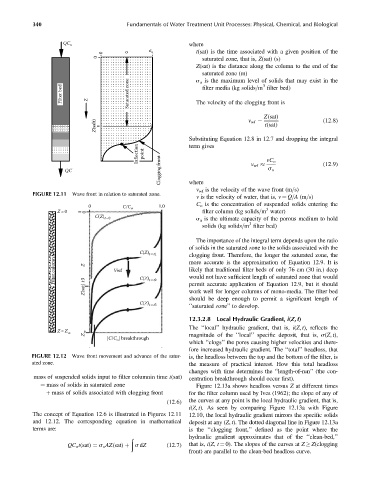
Filter bed Z Saturated zone The velocity of the clogging front is
filter media (kg solids=m filter bed)
Z(sat) (12:8)
Z(salt) v wf ¼ t(sat)
Substituting Equation 12.8 in 12.7 and dropping the integral
term gives
Inflection point vC o
Clogging front v wf s u (12:9)
QC
where
v wf is the velocity of the wave front (m=s)
FIGURE 12.11 Wave front in relation to saturated zone.
v is the velocity of water, that is, v ¼ Q=A (m=s)
0 C/C o 1.0 C o is the concentration of suspended solids entering the
3
Z =0 0 filter column (kg solids=m water)
C(Z) t=0 s u is the ultimate capacity of the porous medium to hold
3
solids (kg solids=m filter bed)
The importance of the integral term depends upon the ratio
of solids in the saturated zone to the solids associated with the
C(Z) t = t1 clogging front. Therefore, the longer the saturated zone, the
Filter column Z Vwf C(Z) more accurate is the approximation of Equation 12.9. It is
likely that traditional filter beds of only 76 cm (30 in.) deep
would not have sufficient length of saturated zone that would
Z(sat) t3 t = t2 permit accurate application of Equation 12.9, but it should
work well for longer columns of mono-media. The filter bed
should be deep enough to permit a significant length of
C(Z) t = t3 ‘‘saturated zone’’ to develop.
12.3.2.8 Local Hydraulic Gradient, i(Z, t)
The ‘‘local’’ hydraulic gradient, that is, i(Z, t), reflects the
Z =Z
o Z o magnitude of the ‘‘local’’ specific deposit, that is, s(Z, t),
[C/C ] breakthrough
o
which ‘‘clogs’’ the pores causing higher velocities and there-
fore increased hydraulic gradient. The ‘‘total’’ headloss, that
FIGURE 12.12 Wave front movement and advance of the satur- is, the headloss between the top and the bottom of the filter, is
ated zone. the measure of practical interest. How this total headloss
changes with time determines the ‘‘length-of-run’’ (the con-
mass of suspended solids input to filter columnin time t(sat) centration breakthrough should occur first).
¼ mass of solids in saturated zone Figure 12.13a shows headloss versus Z at different times
þ mass of solids associated with clogging front for the filter column used by Ives (1962); the slope of any of
(12:6) the curves at any point is the local hydraulic gradient, that is,
i(Z, t). As seen by comparing Figure 12.13a with Figure
The concept of Equation 12.6 is illustrated in Figures 12.11 12.10, the local hydraulic gradient mirrors the specific solids
and 12.12. The corresponding equation in mathematical deposit at any (Z, t). The dotted diagonal line in Figure 12.13a
terms are: is the ‘‘clogging front,’’ defined as the point where the
hydraulic gradient approximates that of the ‘‘clean-bed,’’
ð
QC o t(sat) ¼ s u AZ(sat) þ s dZ (12:7) that is, i(Z, t ¼ 0). The slopes of the curves at Z Z(clogging
front) are parallel to the clean-bed headloss curve.