
Page 383 - Fundamentals of Water Treatment Unit Processes : Physical, Chemical, and Biological
P. 383
338 Fundamentals of Water Treatment Unit Processes: Physical, Chemical, and Biological
140
140
120
120
100
C (mg sus. solids/L) 80 60
100
80
60
40
40
20
20
0 0
0 1440
2 880
4 6
8 440
10 12 Z (cm) 18 20 22 24 26 28 30 32 180 240 320 Time (min)
14
16
34
36
40
44
80
48
20
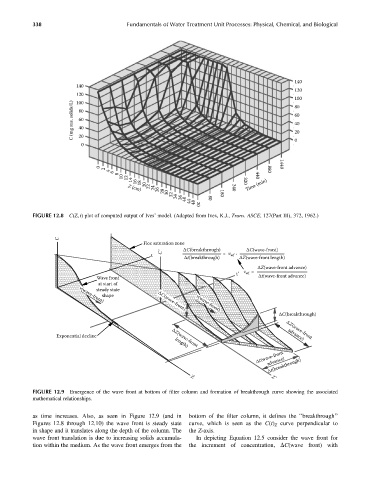
FIGURE 12.8 C(Z, t) plot of computed output of Ives’ model. (Adapted from Ives, K.J., Trans. ASCE, 127(Part III), 372, 1962.)
C
Floc saturation zone
C ' ΔC(breakthrough) = v ΔC(wave-front)
t wf •
Δt(breakthrough) ΔZ(wave-front length)
ΔZ(wave-front advance)
t' v wf =
Wave front Δt(wave-front advance)
at start of
steady state
shape ΔC(wave-front) v(wave-front)
v(wave-front)
ΔC(breakthrough)
Exponential decline ΔZ(wave-front ΔZ(wave-front
advance)
length)
Δt(wave-front
advance)
Δt(breakthrough)
Z Z'
FIGURE 12.9 Emergence of the wave front at bottom of filter column and formation of breakthrough curve showing the associated
mathematical relationships.
as time increases. Also, as seen in Figure 12.9 (and in bottom of the filter column, it defines the ‘‘breakthrough’’
Figures 12.8 through 12.10) the wave front is steady state curve, which is seen as the C(t) Z curve perpendicular to
in shape and it translates along the depth of the column. The the Z-axis.
wave front translation is due to increasing solids accumula- In depicting Equation 12.5 consider the wave front for
tion within the medium. As the wave front emerges from the the increment of concentration, DC(wave front) with