Page 390 - Fundamentals of Water Treatment Unit Processes : Physical, Chemical, and Biological
P. 390

Rapid Filtration                                                                                 345


                                                                                  Log C/C
                                 Q                                                     o
                                           0         C/C o       1.0    0.01        0.1         1.0
                                          0                             0
                                                            t 0


                                                 Saturated zone at t n               2.3  λ
                                          Z(sat)                        Z(sat)         t 0

                               Filter
                                         Z (cm)  Inflection            Z (cm)    Inflection
                              media
                                                  Point
                                                                                   point
                                                     t n                           2.3  λ


                                                                                     t n


                          (a)         (b)  100                      (c) 100

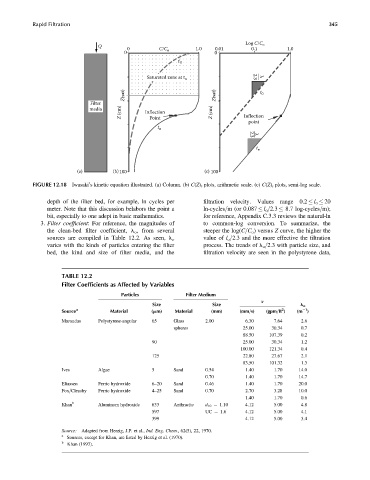
            FIGURE 12.18 Iwasaki’s kinetic equation illustrated. (a) Column. (b) C(Z) t plots, arithmetic scale. (c) C(Z) t plots, semi-log scale.

                 depth of the filter bed, for example, ln cycles per  filtration  velocity.  Values  range  0.2   l o   20
                 meter. Note that this discussion belabors the point a  ln-cycles=m (or 0.087   l o =2.3   8.7 log-cycles=m);
                 bit, especially to one adept in basic mathematics.  for reference, Appendix C.3.3 reviews the natural-ln
              3. Filter coefficient: For reference, the magnitudes of  to common-log conversion. To summarize, the
                 the clean-bed filter coefficient, l o , from several  steeper the log(C=C o ) versus Z curve, the higher the
                                                                    value of l o =2.3 and the more effective the filtration
                 sources are compiled in Table 12.2. As seen, l o
                 varies with the kinds of particles entering the filter  process. The trends of l o =2.3 with particle size, and
                 bed, the kind and size of filter media, and the     filtration velocity are seen in the polystyrene data,


                     TABLE 12.2
                     Filter Coefficients as Affected by Variables
                                         Particles            Filter Medium
                                                                                       v
                                                   Size                Size                         l o
                                                                                                      1
                                                                                              2
                     Source a        Material      (mm)    Material    (mm)     (mm=s)   (gpm=ft )  (m )
                     Maroudas    Polystyrene-angular  65  Glass      2.00         6.30     7.64     2.6
                                                          spheres                25.00    30.34     0.7
                                                                                 88.50    107.39    0.2
                                                   90                            25.00    30.34     1.2
                                                                                100.00    121.34    0.4
                                                   125                           22.80    27.67     2.1
                                                                                 83.50    101.32    1.3
                     Ives        Algae             5      Sand       0.54         1.40     1.70    14.0
                                                                     0.70         1.40     1.70    14.7
                     Eliassen    Ferric hydroxide  6–20   Sand       0.46         1.40     1.70    20.0
                     Fox=Cleasby  Ferric hydroxide  4–25  Sand       0.70         2.70     3.28    10.0
                                                                                  1.40     1.70     0.6
                     Khan b      Aluminum hydroxide  633  Anthracite  d 10 ¼ 1.10  4.12    5.00     4.8
                                                   597               UC ¼ 1.6     4.12     5.00     4.1
                                                   399                            4.12     5.00     3.4
                     Source: Adapted from Herzig, J.P. et al., Ind. Eng. Chem., 62(5), 22, 1970.
                     a
                       Sources, except for Khan, are listed by Herzig et al. (1970).
                     b
                       Khan (1993).
   385   386   387   388   389   390   391   392   393   394   395