
Page 393 - Fundamentals of Water Treatment Unit Processes : Physical, Chemical, and Biological
P. 393
348 Fundamentals of Water Treatment Unit Processes: Physical, Chemical, and Biological
TABLE CD12.3
Excerpt—Calculation of Transport Coefficients and Filter Coefficients by Excel Spreadsheet
Fixed Data Variable Value Units Range
Viscosity formula: e ¼ 0.35 0.35–0.55
5 6 2 9 3
m ¼ 0.001787 5.61324 10 T þ 1.0031 10 T – 7.541 10 T d ¼ 0.45 mm 0.30–0.5
2 2
Boltzmann ¼ 1.39E 23 kg m =s d p ¼ 0.1 m 0.01–500
25 8C 0–30
T ¼
5 gpm=ft 2 0.5–15
v o ¼
1.05 g=cm 3 1.01–1.20
r ¼
Data Diffusion
d d 3(1 e)=2d k T T(abs) m d p HLR
1
2
2
2
e (mm) (m) a (m ) (kg m =s ) (8C) (8K) kg=(m s) (m) (gpm=ft )
0.35 0.45 4.50E 04 1.00 2.17E þ 03 1.39E 23 25 298 8.93E 04 1.00E 07 5.0
0.35 0.45 4.50E 04 1.00 2.17E þ 03 1.39E 23 25 298 8.93E 04 3.00E 07 5.0
0.35 0.45 4.50E 04 1.00 2.17E þ 03 1.39E 23 25 298 8.93E 04 5.00E 07 5.0
0.35 0.45 4.50E 04 1.00 2.17E þ 03 1.39E 23 25 298 8.93E 04 7.00E 07 5.0
0.35 0.45 4.50E 04 1.00 2.17E þ 03 1.39E 23 25 298 8.93E 04 1.00E 06 5.0
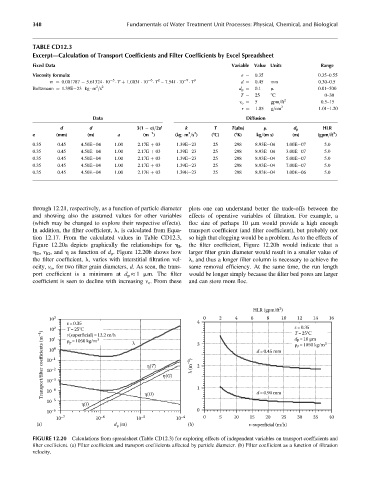
through 12.21, respectively, as a function of particle diameter plots one can understand better the trade-offs between the
and showing also the assumed values for other variables effects of operative variables of filtration. For example, a
(which may be changed to explore their respective effects). floc size of perhaps 10 mm would provide a high enough
In addition, the filter coefficient, l, is calculated from Equa- transport coefficient (and filter coefficient), but probably not
tion 12.17. From the calculated values in Table CD12.3, so high that clogging would be a problem. As to the effects of
Figure 12.20a depicts graphically the relationships for h I , the filter coefficient, Figure 12.20b would indicate that a
h D , h G , and h as function of d p . Figure 12.20b shows how larger filter grain diameter would result in a smaller value of
the filter coefficient, l, varies with interstitial filtration vel- l, and thus a longer filter column is necessary to achieve the
ocity, v o , for two filter grain diameters, d. As seen, the trans- same removal efficiency. At the same time, the run length
port coefficient is a minimum at d p 1 mm. The filter would be longer simply because the filter bed pores are larger
coefficient is seen to decline with increasing v o . From these and can store more floc.
2
HLR (gpm/ft )
10 3 0 2 4 6 8 10 12 14 16
ε= 0.35 4
10 2 1 T =25°C 3 λ 3 ε=0.35 3
Transport/filter coefficients (m –1 ) 10 10 –1 0 η(T) η(G) λ (m –1 ) 2 d=0.45 mm
T =25°C
v(superficial)=12.2 m/h
=10 μm
10
d P
ρ p =1050 kg/m
ρ =1050 kg/m
P
–2
10
–3
10
10
–5
10 –4 η(D) 1 d=0.90 mm
η(I)
10 –6 0
10 –7 10 –6 10 –5 10 –4 0 5 10 15 20 25 30 35 40
(a) d (m) (b) v-superficial (m/h)
p
FIGURE 12.20 Calculations from spreadsheet (Table CD12.3) for exploring effects of independent variables on transport coefficients and
filter coefficient. (a) Filter coefficient and transport coefficients affected by particle diameter. (b) Filter coefficient as a function of filtration
velocity.