
Page 394 - Fundamentals of Water Treatment Unit Processes : Physical, Chemical, and Biological
P. 394
Rapid Filtration 349
Example 12.3 Set Up a Spreadsheet to Calculate
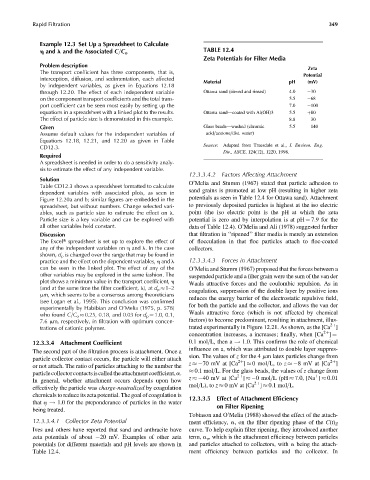
TABLE 12.4
h and l and the Associated C=C o
Zeta Potentials for Filter Media
Problem description Zeta
The transport coefficient has three components, that is, Potential
interception, diffusion, and sedimentation, each affected
Material pH (mV)
by independent variables, as given in Equations 12.18
through 12.20. The effect of each independent variable Ottawa sand (sieved and rinsed) 4.0 30
on the component transport coefficients and the total trans- 5.5 68
port coefficient can be seen most easily by setting up the 7.0 100
equations in a spreadsheet with a linked plot to the results. Ottawa sand—coated with Al(OH)3 5.5 þ80
The effect of particle size is demonstrated in this example. 8.8 30
Given Glass beads—washed (chromic 5.5 140
Assume default values for the independent variables of acid=acetone=dist. water)
Equations 12.18, 12.21, and 12.20 as given in Table
CD12.3. Source: Adapted from Truesdale et al., J. Environ. Eng.
Div., ASCE, 124(12), 1220, 1998.
Required
A spreadsheet is needed in order to do a sensitivity analy-
sis to estimate the effect of any independent variable.
12.3.3.4.2 Factors Affecting Attachment
Solution
Table CD12.3 shows a spreadsheet formatted to calculate O’Melia and Stumm (1967) stated that particle adhesion to
dependent variables with associated plots, as seen in sand grains is promoted at low pH (resulting in higher zeta
Figure 12.20a and b; similar figures are embedded in the potentials as seen in Table 12.4 for Ottawa sand). Attachment
spreadsheet, but without numbers. Change selected vari- to previously deposited particles is highest at the iso electric
ables, such as particle size to estimate the effect on l. point (the iso electric point is the pH at which the zeta
Particle size is a key variable and can be explored with potential is zero and by interpolation is at pH ¼ 7.9 for the
all other variables held constant. data of Table 12.4). O’Melia and Ali (1978) suggested further
Discussion that filtration in ‘‘ripened’’ filter media is merely an extension
The Excelt spreadsheet is set up to explore the effect of of flocculation in that floc particles attach to floc-coated
any of the independent variables on h and l. In the case collectors.
shown, d p is changed over the range that may be found in
practice and the effect on the dependent variables, h and l 12.3.3.4.3 Forces in Attachment
can be seen in the linked plot. The effect of any of the O’Melia and Stumm (1967) proposed that the forces between a
other variables may be explored in the same fashion. The suspended particle and a filter grain were the sum of the van der
plot shows a minimum value in the transport coefficient, h Waals attractive forces and the coulombic repulsion. As in
(and at the same time the filter coefficient, l), at d p 1–2 coagulation, suppression of the double layer by positive ions
mm, which seems to be a consensus among theoreticians
(see Logan et al., 1995). This conclusion was confirmed reduces the energy barrier of the electrostatic repulsive field,
experimentally by Habibian and O’Melia (1975, p. 578) for both the particle and the collector, and allows the van der
who found C=C o 0.25, 0.18, and 0.03 for d p ¼ 1.0, 0.1, Waals attractive force (which is not affected by chemical
7.6 mm, respectively, in filtration with optimum concen- factors) to become predominant, resulting in attachment, illus-
trations of cationic polymer. trated experimentally in Figure 12.21. As shown, as the [Ca ]
2þ
2þ
concentration increases, a increases; finally, when [Ca ] ¼
12.3.3.4 Attachment Coefficient 0.1 mol=L, then a ! 1.0. This confirms the role of chemical
influence on a, which was attributed to double layer suppres-
The second part of the filtration process is attachment. Once a
sion. The values of z for the 4 mm latex particles change from
particle collector contact occurs, the particle will either attach
z 70 mV at [Ca ] 0 mol=L, to z 8 mV at [Ca ]
2þ
2þ
or not attach. The ratio of particles attaching to the number the
0.1 mol=L. For the glass beads, the values of z change from
particlecollectorcontactsiscalledtheattachmentcoefficient,a.
z 40 mV at [Ca ] 0 mol=L (pH 7.0, [Na ] 0.01
þ
2þ
In general, whether attachment occurs depends upon how
mol=L), to z 0 mV at [Ca ] 0.1 mol=L.
2þ
effectively the particle was charge-neutralized by coagulation
chemicals to reduce its zeta potential. The goal of coagulation is
12.3.3.5 Effect of Attachment Efficiency
that a ! 1.0 for the preponderance of particles in the water
:
being treated. on Filter Ripening
Tobiason and O’Melia (1988) showed the effect of the attach-
12.3.3.4.1 Collector Zeta Potential
ment efficiency, a, on the filter ripening phase of the C(t) Z
Ives and others have reported that sand and anthracite have curve. To help explain filter ripening, they introduced another
zeta potentials of about 20 mV. Examples of other zeta term, a p , which is the attachment efficiency between particles
potentials for different materials and pH levels are shown in and particles attached to collectors, with a being the attach-
Table 12.4. ment efficiency between particles and the collector. In