
Page 523 - Fundamentals of Water Treatment Unit Processes : Physical, Chemical, and Biological
P. 523
478 Fundamentals of Water Treatment Unit Processes: Physical, Chemical, and Biological
1.0 1.0
Run DFTM
0.8 0.8 20 h
130 h
15 h
0.6 0.6 10 h
C/C 0 Inflection C/C 0
0.4 60 points 0.4 5 h
50
40
30 Inflection
0.2 0.2 points
20
10 h
Run FVSP
0.0 0.0
0 50 100 150 200 0 50 100 150 200
(a) Z (cm) (b) Z (cm)
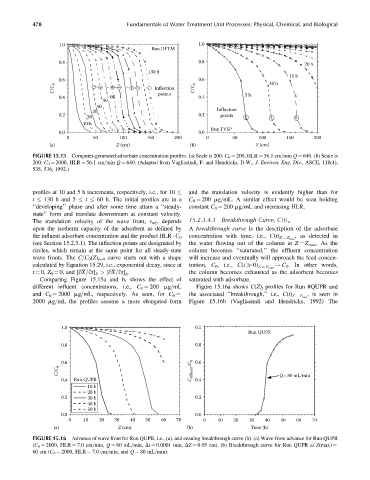
FIGURE 15.15 Computer-generated adsorbate concentration profiles. (a) Scale is 200: C 0 ¼ 200, HLR ¼ 56.1 cm=min Q ¼ 640. (b) Scale is
200: C 0 ¼ 2000, HLR ¼ 56.1 cm=min Q ¼ 640. (Adapted from Vagliasindi, F. and Hendricks, D.W., J. Environ. Eng. Div., ASCE, 118(4),
535, 536, 1992.)
and the translation velocity is evidently higher than for
profiles at 10 and 5 h increments, respectively, i.e., for 10
t 130 h and 5 t 60 h. The initial profiles are in a C 0 ¼ 200 mg=mL. A similar effect would be seen holding
‘‘developing’’ phase and after some time attain a ‘‘steady- constant C 0 ¼ 200 mg=mL and increasing HLR.
state’’ form and translate downstream at constant velocity.
The translation velocity of the wave front, v wf , depends 15.2.3.4.3 Breakthrough Curve, C(t) z
upon the isotherm capacity of the adsorbent as defined by A breakthrough curve is the description of the adsorbate
, as detected in
the influent adsorbate concentration and the product HLR C 0 concentration with time, i.e., C(t) Z ¼ Z max
(see Section 15.2.3.1). The inflection points are designated by the water flowing out of the column at Z ¼ Z max .Asthe
circles, which remain at the same point for all steady-state column becomes ‘‘saturated,’’ the effluent concentration
wave fronts. The C=C 0 (Z) t¼0 curve starts out with a shape will increase and eventually will approach the feed concen-
calculated by Equation 15.29, i.e., exponential decay, since at tration, C 0 , i.e., C(t 0) Z ¼ Z max ! C 0 .Inother words,
t ¼ 0, Z 0 ¼ 0, and [qX=qt] P > [qX=qt] A . the column becomes exhausted as the adsorbent becomes
Comparing Figure 15.15a and b, shows the effect of saturated with adsorbate.
different influent concentrations, i.e., C 0 ¼ 200 mg=mL Figure 15.16a shows C(Z) t profiles for Run #QUPR and
, is seen in
and C 0 ¼ 2000 mg=mL, respectively. As seen, for C 0 ¼ the associated ‘‘breakthrough,’’ i.e., C(t) Z ¼ Z max
2000 mg=mL the profiles assume a more elongated form Figure 15.16b (Vagliasindi and Hendricks, 1992) The
1.0 0.1
Run QUPR
0.8 0.8
0.6 0.6
C/C 0 C effluent /C 0 Q=80 mL/min
0.4 Run QUPR 0.4
10 h
20 h
0.2 30 h 0.2
40 h
50 h
0.0 0.0
0 10 20 30 40 50 60 70 0 10 20 30 40 50 60 70
(a) Z (cm) (b) Time (h)
FIGURE 15.16 Advance of wave front for Run QUPR, i.e., (a), and ensuing breakthrough curve (b). (a) Wave-front advance for Run QUPR
(C 0 ¼ 2000, HLR ¼ 7.0 cm=min, Q ¼ 80 mL=min, Dt ¼ 0.0001 min, DZ ¼ 0.05 cm). (b) Breakthrough curve for Run QUPR at Z(max) ¼
60 cm (C 0 ¼ 2000, HLR ¼ 7.0 cm=min, and Q ¼ 80 mL=min).