
Page 528 - Fundamentals of Water Treatment Unit Processes : Physical, Chemical, and Biological
P. 528
Adsorption 483
15.3 LABORATORY AND PILOT PLANT
TABLE 15.5
STUDIES
Length and Velocity of Wave Front for Different
Conditions by Computer Simulation The most important laboratory data to be generated are
isotherms. A pilot plant study can add more specific informa-
Conditions Results
tion about the behavior of a given system.
HLR C 0 L wf v wf
Adsorbate (m=h) (mg=L) Run (m) (m=day)
15.3.1 QUESTIONS FOR A LABORATORY=PILOT PLANT
Effect of C 0
STUDY
Rhodamine-B 4.2 200 TEBV 0.20 0.037
dye 500 PYSO 0.28 0.090 Some of the questions for a pilot plant investigation include
1000 QGUR 0.40 0.170 type of carbon, bed depth, hydraulic loading rate, hydraulic
2000 QUPR 1.00 0.360 conductivity of the packed bed, backwash head needed, pre-
Effect of HLR treatment advisable, etc. The foregoing list comprises inde-
Rhodamine-B 4.2 500 PYSO 0.28 0.090 pendent variables which may be imposed on the column, one
dye 8.4 DFTP 0.45 0.180 at a time, to assess the effect. The dependent variables of
33.7 DFUH 1.30 0.68 interest include the wave front, C(Z) t and the breakthrough
.
curve, C(t) Z ¼ Z max
Source: Adapted from Vagliasindi, Wave front behavior in adsorption
reactors, MS Thesis, Department of Civil Engineering, Colorado 15.3.1.1 Isotherm Determination
State University, Fort Collins, CO, p. 74, 1991.
As described in Section 15.2.1.2 the experimental determin-
Adsorbent was Dowex 50 cation exchange resin. X* ¼ 726,434; 745,060;
ation of an isotherm is the basis for the prediction of wave-
751,483; 754,736 mg Rhodamine-b=g Dowex 50 resin for C 0 ¼ 200, 500,
front velocity, v wf , as described by Equation 15.48, Section
1000, 2000 mg Rh-B=L, respectively.
15.2.4.1. As noted, most waters contain more than one soluble
organic compound and so the isotherm for a specific com-
pound in a particular mixture would be unique. If TOC
some compounds by bacterial metabolism. In fact, the reduction is an objective, then a pseudo isotherm, as measured
presence of a metabolizing compound is likely to promote by TOC, may be used as an estimate of adsorbent capacity.
such colonization. While some view the bacterial coloniza-
tion as a positive effect, the bacteria may cause higher 15.3.1.2 Determine v(wave front)
impedance to the diffusion of adsorbate molecules to The velocity of the wave front, v wf , may be determined by
adsorption sites. (1) successive direct measurement from sample taps along a
2.0 12
10 1,4-Dioxane
1.5
p-Chlorophenol 8 Nitromethane
C/C 0 1.0 Concentration (mol/L)×10 –5 6
p-Nitrophenol 4
0.5
2
Methyl ethyl ketone
n-Butanol
0.0 0
0 100 200 300 400 500 0 5 10 15 20
(a) Time (h) (b) Time (h)
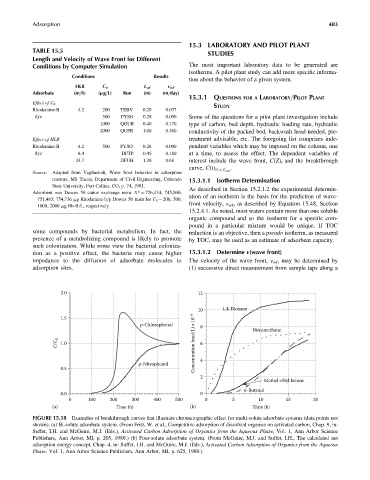
FIGURE 15.18 Examples of breakthrough curves that illustrate chromatographic effect for multi-solute adsorbate systems (data points not
shown). (a) Bi-solute adsorbate system. (From Fritz, W. et al., Competitive adsorption of dissolved organics on activated carbon, Chap. 9, in:
Suffet, I.H. and McGuire, M.J. (Eds.), Activated Carbon Adsorption of Organics from the Aqueous Phase, Vol. 1, Ann Arbor Science
Publishers, Ann Arbor, MI, p. 205, 1980.) (b) Four-solute adsorbate system. (From McGuire, M.J. and Suffet, I.H., The calculated net
adsorption energy concept, Chap. 4, in: Suffet, I.H. and McGuire, M.J. (Eds.), Activated Carbon Adsorption of Organics from the Aqueous
Phase, Vol. 1, Ann Arbor Science Publishers, Ann Arbor, MI, p. 625, 1980.)