
Page 529 - Fundamentals of Water Treatment Unit Processes : Physical, Chemical, and Biological
P. 529
484 Fundamentals of Water Treatment Unit Processes: Physical, Chemical, and Biological
column, (2) measurement of the breakthrough curve, and each of the tubes to prevent adsorbent particles from entering.
(3) calculation using Equation 15.48. The column may be acrylic plastic (Plexiglas), or clear PVC
(which is not transparent). Fittings can be attached easily to
15.3.1.3 L(wave front) PVC (using a cement) while a machinist may be needed to
The length of the wave front, L wf , may be determined by work with the acrylic. Piezometers should be installed, e.g., at
100 mm, mounted on a board with scale attached.
direct measurement from sampling taps. Alternatively, L wf
may be estimated by calculation from the breakthrough
curve measurement using Equation 15.42.
15.3.2 DEMONSTRATION-SCALE PLANTS
15.3.1.4 Breakthrough Curve As noted in Chapter 3, a demonstration-scale plant addresses
The breakthrough curve is the most common measurement questions of process design, but is large enough to provide
obtained from pilot plant studies. As noted in the foregoing additional data on such issues as labor requirements, logistics
paragraphs, v wf and L wf may be determined from the meas- of GAC supplies, storage, regeneration of carbon, energy
urement of a breakthrough curve. needs, estimation of costs, and unforeseen problems. Two
examples are the Pomona, California plant, c. 1967 and later
15.3.1.5 Rate of Headloss Increase the Denver Water Reuse Plant, c. 1982.
The measurement of hydraulic gradient may be obtained by
piezometer measurements along the length of the column. The 15.3.2.1 Pomona
simultaneous measurement of Q and calculation of HLR One of the best known activated carbon demonstration-scale
3
and temperature permits determination of intrinsic permeabil- pilot plants in the 1960s was a 1,136 m =day (0.3 mgd)
3
ity, k, per Equation E.5. Whether k increases with time is of installation at the 17,033 m =day (4.5 mgd) Pomona Water
interest also. Reclamation Plant operated by the Federal Water Quality
Administration (which became USEPA in 1971) and the Sani-
15.3.1.6 Backwash Velocity tation Districts of Los Angeles County (Parkhurst et al., 1967).
Backwash velocity requires empirical determination by noting Initially, sponsorship was a part of the USPHS AWTR pro-
the HLR when the bed becomes suspended. As the HLR gram to explore new technologies for wastewater treatment and
increases, the hydraulic gradient increases at the same time; help to develop those that were most promising. The design,
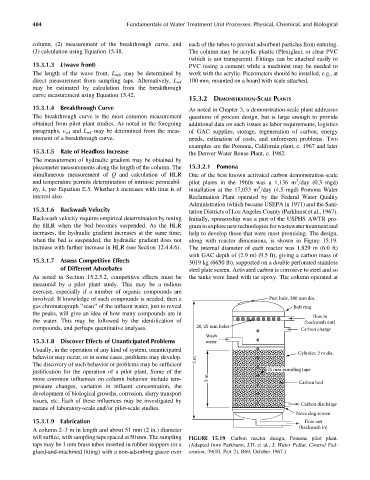
when the bed is suspended, the hydraulic gradient does not along with reactor dimensions, is shown in Figure 15.19.
increase with further increase in HLR (see Section 12.4.4.6). The internal diameter of each reactor was 1.829 m (6.0 ft)
with GAC depth of (2.9 m) (9.5 ft), giving a carbon mass of
15.3.1.7 Assess Competitive Effects 3019 kg (6650 lb), supported on a double perforated stainless
of Different Adsorbates steel plate screen. Activated carbon is corrosive to steel and so
As noted in Section 15.2.5.2, competitive effects must be the tanks were lined with tar epoxy. The column operated at
measured by a pilot plant study. This may be a tedious
exercise, especially if a number of organic compounds are
involved. If knowledge of such compounds is needed, then a Port hole, 380 mm dia.
gas chromatograph ‘‘scan’’ of the influent water, just to reveal Bolt ring
the peaks, will give an idea of how many compounds are in
Flow in
the water. This may be followed by the identification of (backwash out)
compounds, and perhaps quantitative analyses. 20, 25 mm holes Carbon charge
Wash
15.3.1.8 Discover Effects of Unanticipated Problems water
Usually, in the operation of any kind of system, unanticipated
Cylinder, 2 m dia.
behavior may occur, or in some cases, problems may develop. 5 m
The discovery of such behavior or problems may be sufficient
justification for the operation of a pilot plant. Some of the 25 mm sampling taps
more common influences on column behavior include tem- 3 m Carbon bed
perature changes, variation in influent concentration, the
development of biological growths, corrosion, slurry transport
issues, etc. Each of these influences may be investigated by
Carbon discharge
means of laboratory-scale and=or pilot-scale studies.
Neva clog screen
15.3.1.9 Fabrication Flow out
(backwash in)
A column 2–3 m in length and about 51 mm (2 in.) diameter
will suffice, with sampling taps spaced at 50 mm. The sampling FIGURE 15.19 Carbon reactor design, Pomona pilot plant.
taps may be 1 mm brass tubes inserted in rubber stoppers (or a (Adapted from Parkhurst, J.D. et al., J. Water Pollut. Control Fed-
glued-and-machined fitting) with a non-adsorbing gauze over eration, 39(10, Part 2), R69, October 1967.)