
Page 530 - Fundamentals of Water Treatment Unit Processes : Physical, Chemical, and Biological
P. 530
Adsorption 485
12.6 L=s (200 gpm) or at a hydraulic loading rate of 17.1 m=h which continued until 1974. Based on the pilot plant study,
2
(7 gpm=ft ). Backwashing rate was 12.62 L=s (200 gpm) max- construction of a demonstration-scale plant was started in
imum, which allowed for 35% bed expansion, with a total flow 1981 and placed in operation initially about 1984, being put
of about 18,925 L (5,000 gal) per backwash. The lead reactor in on-line in 1985 (after the ‘‘shakedown’’ operation and work-
the series was backwashed 30–45 min. each day. ing out ‘‘bugs,’’ e.g., corrosion control). The construction cost
The plant had five carbon bed reactors, with four operated was about $20 million with $7 million from USEPA. The site
in series, and in the downflow mode. One was operated alone for the Reuse Plant was just across the South Platte River from
for greater experimental flexibility. The reactors were rotated ‘‘Denver Metro’’; the flow of secondary effluent taken for the
3
in position designations, i.e., A, B, C, D; the A designation Reuse Plant was Q(GAC) ¼ 3785 m =day (1.0 mgd).
3
was the lead reactor. The position change was accomplished The 3785 m =day (1.0 mgd) main treatment train was lime
by changing valve open=close positions in the plumbing. The coagulation, flocculation, settling, filtration, ion-exchange,
reactor with the freshly regenerated carbon always came on and first-stage GAC, with 0.9 fraction of the flow going to
3
line in the D position, while the reactor taken out of service industrial use with a 380 m =day (0.1 mgd) sidestream
for regeneration always came from the A position. to ozone, second-stage GAC, reverse osmosis, air stripping
The influent COD varied 25 COD 39 mg=L and (to remove CO 2 and VOCs), and disinfection. The plant had
showed a random pattern of variation. Carbon (as COD) remain- the capability to investigate different treatment train
ing after column D varied 2 COD(effluent) 13 mg=L, with sequences and to examine proposed unit processes or tech-
nominal values 5 mg COD=L. About 76 million L (20 mg) nology variations by means of sidestreams.
of water could be treated before the product water COD Objectives were (1) to investigate the health effects of its
reached 12 mg=L. In terms of carbon capacity, the adsorp- effluent on laboratory animals, (2) to estimate the operating
tion of organics was about 0.60 kg COD=kg carbon costs of a full-scale plant, (3) to discover any exigencies in
(60 lb COD=100 lb of carbon). operation (i.e., unanticipated issues), and (4) to provide a
basis for the design of a full-scale plant (if built). The plant
15.3.2.2 Denver Reuse Plant completed its plan of study in December 1991 and was taken
3
The 3785 m =day (1.0 mgd) Denver Potable Water Reuse out of service at that time.
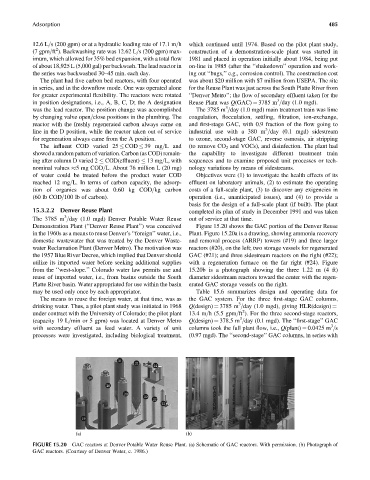
Demonstration Plant (‘‘Denver Reuse Plant’’) was conceived Figure 15.20 shows the GAC portion of the Denver Reuse
in the 1960s as a means to reuse Denver’s ‘‘foreign’’ water, i.e., Plant. Figure 15.20a is a drawing, showing ammonia recovery
domestic wastewater that was treated by the Denver Waste- and removal process (ARRP) towers (#19) and three larger
water Reclamation Plant (Denver Metro). The motivation was reactors (#20), on the left; two storage vessels for regenerated
the 1957 Blue River Decree, which implied that Denver should GAC (#21); and three sidestream reactors on the right (#22);
utilize its imported water before seeking additional supplies with a regeneration furnace on the far right (#24). Figure
from the ‘‘west-slope.’’ Colorado water law permits use and 15.20b is a photograph showing the three 1.22 m (4 ft)
reuse of imported water, i.e., from basins outside the South diameter sidestream reactors toward the center with the regen-
Platte River basin. Water appropriated for use within the basin erated GAC storage vessels on the right.
may be used only once by each appropriator. Table 15.6 summarizes design and operating data for
The means to reuse the foreign water, at that time, was as the GAC system. For the three first-stage GAC columns,
3
drinking water. Thus, a pilot plant study was initiated in 1968 Q(design) ¼ 3785 m =day (1.0 mgd), giving HLR(design) ¼
2
under contract with the University of Colorado; the pilot plant 13.4 m=h (5.5 gpm=ft ). For the three second-stage reactors,
3
(capacity 19 L=min or 5 gpm) was located at Denver Metro Q(design) ¼ 378.5 m =day (0.1 mgd). The ‘‘first-stage’’ GAC
3
with secondary effluent as feed water. A variety of unit columns took the full plant flow, i.e., Q(plant) ¼ 0.0425 m =s
processes were investigated, including biological treatment, (0.97 mgd). The ‘‘second-stage’’ GAC columns, in series with
21
21
24
20
20
20
22
22
22
19
(a) (b)
FIGURE 15.20 GAC reactors at Denver Potable Water Reuse Plant. (a) Schematic of GAC reactors. With permission. (b) Photograph of
GAC reactors. (Courtesy of Denver Water, c. 1986.)