
Page 531 - Fundamentals of Water Treatment Unit Processes : Physical, Chemical, and Biological
P. 531
486 Fundamentals of Water Treatment Unit Processes: Physical, Chemical, and Biological
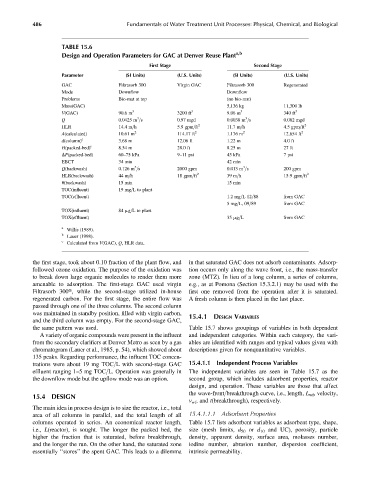
TABLE 15.6
Design and Operation Parameters for GAC at Denver Reuse Plant a,b
First Stage Second Stage
Parameter (SI Units) (U.S. Units) (SI Units) (U.S. Units)
GAC Filtrasorb 300 Virgin GAC Filtrasorb 300 Regenerated
Mode Downflow Downflow
Problems Bio-mat at top (no bio-mat)
Mass(GAC) 5,136 kg 11,300 lb
3 3 3 3
V(GAC) 90.6 m 3200 ft 9.06 m 340 ft
3
3
Q 0.0425 m =s 0.97 mgd 0.0038 m =s 0.082 mgd
2 2
HLR 14.4 m=h 5.9 gpm=ft 11.7 m=h 4.5 gpm=ft
A(calculated) 10.61 m 2 114.17 ft 2 1.176 m 2 12.654 ft 2
d(column) c 3.68 m 12.06 ft 1.22 m 4.0 ft
H(packed-bed) c 8.54 m 28.0 ft 8.25 m 27 ft
DP(packed-bed) 60–75 kPa 9–11 psi 45 kPa 7 psi
EBCT 34 min 42 min
3
3
Q(backwash) 0.126 m =s 2000 gpm 0.013 m =s 200 gpm
HLR(backwash) 44 m=h 18 gpm=ft 2 39 m=h 15.9 gpm=ft 2
u(backwash) 15 min 15 min
TOC(influent) 19 mg=L to plant
TOC(effluent) 1.2 mg=L12=88 from GAC
5mg=L, 09=89 from GAC
TOX(influent) 84 mg=L to plant
TOX(effluent) 35 mg=L from GAC
a
Willis (1989).
b
Lauer (1998).
c
Calculated from V(GAC), Q, HLR data.
the first stage, took about 0.10 fraction of the plant flow, and in that saturated GAC does not adsorb contaminants. Adsorp-
followed ozone oxidation. The purpose of the oxidation was tion occurs only along the wave front, i.e., the mass-transfer
to break down large organic molecules to render them more zone (MTZ). In lieu of a long column, a series of columns,
amenable to adsorption. The first-stage GAC used virgin e.g., as at Pomona (Section 15.3.2.1) may be used with the
Filtrasorb 300t, while the second-stage utilized in-house first one removed from the operation after it is saturated.
regenerated carbon. For the first stage, the entire flow was A fresh column is then placed in the last place.
passed through one of the three columns. The second column
was maintained in standby position, filled with virgin carbon,
15.4.1 DESIGN VARIABLES
and the third column was empty. For the second-stage GAC,
the same pattern was used. Table 15.7 shows groupings of variables in both dependent
A variety of organic compounds were present in the influent and independent categories. Within each category, the vari-
from the secondary clarifiers at Denver Metro as seen by a gas ables are identified with ranges and typical values given with
chromatogram (Lauer et al., 1985, p. 54), which showed about descriptions given for nonquantitative variables.
135 peaks. Regarding performance, the influent TOC concen-
trations were about 19 mg TOC=L with second-stage GAC 15.4.1.1 Independent Process Variables
effluent ranging 1–5 mg TOC=L. Operation was generally in The independent variables are seen in Table 15.7 as the
the downflow mode but the upflow mode was an option. second group, which includes adsorbent properties, reactor
design, and operation. These variables are those that affect
the wave-front=breakthrough curve, i.e., length, L wf , velocity,
15.4 DESIGN
v wf , and t(breakthrough), respectively.
The main idea in process design is to size the reactor, i.e., total
area of all columns in parallel, and the total length of all 15.4.1.1.1 Adsorbent Properties
columns operated in series. An economical reactor length, Table 15.7 lists adsorbent variables as adsorbent type, shape,
i.e., L(reactor), is sought. The longer the packed bed, the size (mesh limits, d 50 or d 10 and UC), porosity, particle
higher the fraction that is saturated, before breakthrough, density, apparent density, surface area, molasses number,
and the longer the run. On the other hand, the saturated zone iodine number, abrasion number, dispersion coefficient,
essentially ‘‘stores’’ the spent GAC. This leads to a dilemma intrinsic permeability.