
Page 527 - Fundamentals of Water Treatment Unit Processes : Physical, Chemical, and Biological
P. 527
482 Fundamentals of Water Treatment Unit Processes: Physical, Chemical, and Biological
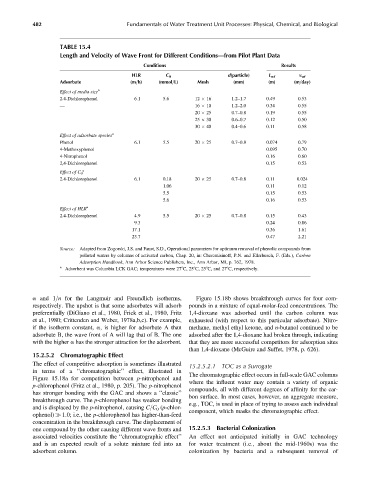
TABLE 15.4
Length and Velocity of Wave Front for Different Conditions—from Pilot Plant Data
Conditions Results
HLR C 0 d(particle) L wf v wf
Adsorbate (m=h) (mmol=L) Mesh (mm) (m) (m=day)
Effect of media size a
2.4-Dichlorophenol 6.1 5.6 12 16 1.2–1.7 0.49 0.53
— 16 10 1.2–2.0 0.34 0.55
20 25 0.7–0.8 0.19 0.55
25 30 0.6–0.7 0.12 0.50
30 40 0.4–0.6 0.11 0.58
Effect of adsorbate species a
Phenol 6.1 5.5 20 25 0.7–0.8 0.074 0.79
4-Methoxyphenol 0.095 0.70
4-Nitrophenol 0.16 0.60
2,4-Dichlorophenol 0.15 0.53
a
Effect of C 0
2.4-Dichlorophenol 6.1 0.18 20 25 0.7–0.8 0.11 0.024
1.06 0.11 0.12
5.5 0.15 0.53
5.6 0.16 0.53
Effect of HLR a
2.4-Dichlorophenol 4.9 5.5 20 25 0.7–0.8 0.15 0.43
9.3 0.24 0.86
17.1 0.36 1.61
23.7 0.47 2.21
Source: Adapted from Zogorski, J.S. and Faust, S.D., Operational parameters for optimum removal of phenolic compounds from
polluted waters by columns of activated carbon, Chap. 20, in: Cheremisinoff, P.N. and Ellerbusch, F. (Eds.), Carbon
Adsorption Handbook, Ann Arbor Science Publishers, Inc., Ann Arbor, MI, p. 762, 1978.
a
Adsorbent was Columbia LCK GAC; temperatures were 278C, 258C, 258C, and 278C, respectively.
a and 1=n for the Langmuir and Freundlich isotherms, Figure 15.18b shows breakthrough curves for four com-
respectively. The upshot is that some adsorbates will adsorb pounds in a mixture of equal-molar-feed concentrations. The
preferentially (DiGiano et al., 1980, Frick et al., 1980, Fritz 1,4-dioxane was adsorbed until the carbon column was
et al., 1980; Crittenden and Weber, 1978a,b,c). For example, exhausted (with respect to this particular adsorbate). Nitro-
if the isotherm constant, a, is higher for adsorbate A than methane, methyl ethyl ketone, and n-butanol continued to be
adsorbate B, the wave front of A will lag that of B. The one adsorbed after the 1,4-dioxane had broken through, indicating
with the higher a has the stronger attraction for the adsorbent. that they are more successful competitors for adsorption sites
than 1,4-dioxane (McGuire and Suffet, 1978, p. 626).
15.2.5.2 Chromatographic Effect
The effect of competitive adsorption is sometimes illustrated 15.2.5.2.1 TOC as a Surrogate
in terms of a ‘‘chromatographic’’ effect, illustrated in
The chromatographic effect occurs in full-scale GAC columns
Figure 15.18a for competition between p-nitrophenol and
where the influent water may contain a variety of organic
p-chlorophenol (Fritz et al., 1980, p. 205). The p-nitrophenol
has stronger bonding with the GAC and shows a ‘‘classic’’ compounds, all with different degrees of affinity for the car-
bon surface. In most cases, however, an aggregate measure,
breakthrough curve. The p-chlorophenol has weaker bonding
e.g., TOC, is used in place of trying to assess each individual
and is displaced by the p-nitrophenol, causing C=C 0 (p-chlor-
component, which masks the chromatographic effect.
ophenol) 1.0; i.e., the p-chlorophenol has higher-than-feed
concentration in the breakthrough curve. The displacement of
one compound by the other causing different wave fronts and 15.2.5.3 Bacterial Colonization
associated velocities constitute the ‘‘chromatographic effect’’ An effect not anticipated initially in GAC technology
and is an expected result of a solute mixture fed into an for water treatment (i.e., about the mid-1960s) was the
adsorbent column. colonization by bacteria and a subsequent removal of