
Page 538 - Fundamentals of Water Treatment Unit Processes : Physical, Chemical, and Biological
P. 538
Adsorption 493
William T. Love, an entrepreneur who, in 1892, saw a canal as 1000
a means for ships to bypass Niagara Falls or, alternatively, to
generate electric energy. Because of loss of financial backing,
only 1 mi of the canal was dug, leaving a body of water 60 ft
wide and 3000 ft long. By 1920, the land was sold and
afterward became a municipal and chemical disposal site. 200
From 1942 through 1953, the Love Canal Landfill was used
principally by Hooker Chemical, one of the many chemical
plants located along the Niagara River. During this period, X* (mg SOC/g GAC) 100
nearly 19,000 metric tons (21,000 U.S. tons) of ‘‘toxic chem-
icals’’ were dumped at the site. In 1953, with the landfill at
maximum capacity, Hooker filled the site with layers of soil.
4200
Human exposures: The Niagara Falls Board of Education then
purchased the Love Canal land from Hooker Chemical for $1.
Included in the deed transfer was a ‘‘warning’’ of the chemical
wastes buried on the property and a disclaimer absolving 10
Hooker of any further liability. Single-family housing soon 100 1000 10 4
surrounded the Love Canal site, and, as the population grew, C* (mg SOC/L)
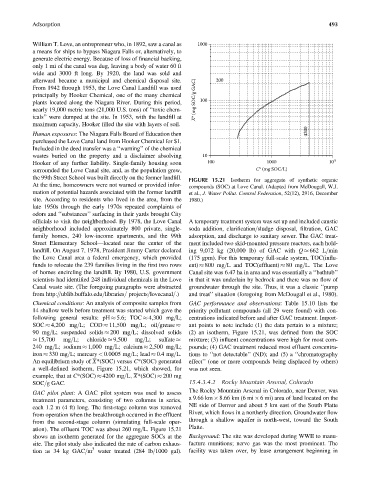
the 99th Street School was built directly on the former landfill. FIGURE 15.21 Isotherm for aggregate of synthetic organic
At the time, homeowners were not warned or provided infor- compounds (SOC) at Love Canal. (Adapted from McDougall, W.J.
mation of potential hazards associated with the former landfill et al., J. Water Pollut. Control Federation, 52(12), 2916, December
site. According to residents who lived in the area, from the 1980.)
late 1950s through the early 1970s repeated complaints of
odors and ‘‘substances’’ surfacing in their yards brought City
officials to visit the neighborhood. By 1978, the Love Canal A temporary treatment system was set up and included caustic
neighborhood included approximately 800 private, single- soda addition, clarification=sludge disposal, filtration, GAC
family homes, 240 low-income apartments, and the 99th adsorption, and discharge to sanitary sewer. The GAC treat-
Street Elementary School—located near the center of the ment included two skid-mounted pressure reactors, each hold-
landfill. On August 7, 1978, President Jimmy Carter declared ing 9,072 kg (20,000 lb) of GAC with Q 662 L=min
the Love Canal area a federal emergency, which provided (175 gpm). For this temporary full-scale system, TOC(influ-
funds to relocate the 239 families living in the first two rows ent) 800 mg=L and TOC(effluent) 80 mg=L. The Love
of homes encircling the landfill. By 1980, U.S. government Canal site was 6.47 ha in area and was essentially a ‘‘bathtub’’
scientists had identified 248 individual chemicals in the Love in that it was underlain by bedrock and there was no flow of
Canal waste site. (The foregoing paragraphs were abstracted groundwater through the site. Thus, it was a classic ‘‘pump
from http:==ublib.buffalo.edu=libraries= projects=lovecanal=.) and treat’’ situation (foregoing from McDougall et al., 1980).
Chemical conditions: An analysis of composite samples from GAC performance and observations: Table 15.10 lists the
14 shallow wells before treatment was started which gave the priority pollutant compounds (all 29 were found) with con-
following general results: pH 5.6; TOC 4,300 mg=L; centrations indicated before and after GAC treatment. Import-
ant points to note include (1) the data pertain to a mixture;
SOC 4,200 mg=L; COD 11,500 mg=L; oil=grease
90 mg=L; suspended solids 200 mg=L; dissolved solids (2) an isotherm, Figure 15.21, was defined from the SOC
15,700 mg=L; chloride 9,500 mg=L; sulfate mixture; (3) influent concentrations were high for most com-
240 mg=L; sodium 1,000 mg=L; calcium 2,500 mg=L; pounds; (4) GAC treatment reduced most effluent concentra-
iron 330 mg=L; mercury < 0.0005 mg=L; lead 0.4 mg=L. tions to ‘‘not detectable’’ (ND); and (5) a ‘‘chromatography
An equilibrium study of X*(SOC) versus C*(SOC) generated effect’’ (one or more compounds being displaced by others)
a well-defined isotherm, Figure 15.21, which showed, for was not seen.
example, that at C*(SOC) 4200 mg=L, X*(SOC) 200 mg
SOC=g GAC. 15.4.3.4.2 Rocky Mountain Arsenal, Colorado
The Rocky Mountain Arsenal in Colorado, near Denver, was
GAC pilot plant: A GAC pilot system was used to assess
a9.66km 8.66 km (6 mi 6 mi) area of land located on the
treatment parameters, consisting of two columns in series,
NE side of Denver and about 5 km east of the South Platte
each 1.2 m (4 ft) long. The first-stage column was removed
River, which flows in a northerly direction. Groundwater flow
from operation when the breakthrough occurred in the effluent
through a shallow aquifer is north-west, toward the South
from the second-stage column (simulating full-scale oper-
Platte.
ation). The effluent TOC was about 260 mg=L. Figure 15.21
shows an isotherm generated for the aggregate SOCs at the Background: The site was developed during WWII to manu-
site. The pilot study also indicated the rate of carbon exhaus- facture munitions; nerve gas was the most prominent. The
3
tion as 34 kg GAC=m water treated (284 lb=1000 gal). facility was taken over, by lease arrangement beginning in