
Page 540 - Fundamentals of Water Treatment Unit Processes : Physical, Chemical, and Biological
P. 540
Adsorption 495
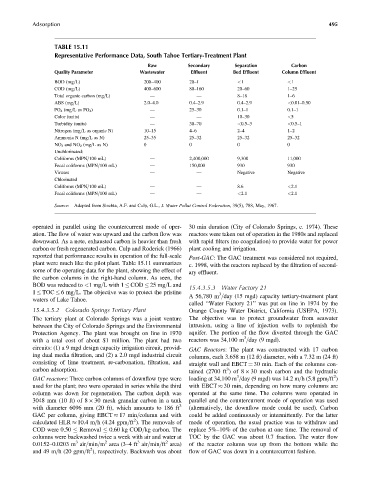
TABLE 15.11
Representative Performance Data, South Tahoe Tertiary-Treatment Plant
Raw Secondary Separation Carbon
Quality Parameter Wastewater Effluent Bed Effluent Column Effluent
BOD (mg=L) 200–400 20–1 <1 <1
COD (mg=L) 400–600 80–160 20–60 1–25
Total organic carbon (mg=L) — — 8–18 1–6
ABS (mg=L) 2.0–4.0 0.4–2.9 0.4–2.9 <0.01–0.50
PO 4 (mg=LasPO 4 ) — 25–30 0.1–1 0.1–1
Color (units) — — 10–30 <5
Turbidity (units) — 30–70 <0.5–3 <0.5–1
Nitrogen (mg=L as organic N) 10–15 4–6 2–4 1–2
Ammonia N (mg=LasN) 25–35 25–32 25–32 25–32
NO 3 and NO 2 (mg=LasN) 0 0 0 0
Unchlorinated:
Coliforms (MPN=100 mL) — 2,400,000 9,300 11,000
Fecal coliforms (MPN=100 mL) — 150,000 930 930
Viruses — — Negative Negative
Chlorinated
Coliforms (MPN=100 mL) — — 8.6 <2.1
Fecal coliforms (MPN=100 mL) — — <2.1 <2.1
Source: Adapted from Slechta, A.F. and Culp, G.L., J. Water Pollut Control Federation, 39(5), 788, May, 1967.
operated in parallel using the countercurrent mode of oper- 30 min duration (City of Colorado Springs, c. 1974). These
ation. The flow of water was upward and the carbon flow was reactors were taken out of operation in the 1980s and replaced
downward. As a note, exhausted carbon is heavier than fresh with rapid filters (no coagulation) to provide water for power
carbon or fresh regenerated carbon. Culp and Roderick (1966) plant cooling and irrigation.
reported that performance results in operation of the full-scale Post-GAC: The GAC treatment was considered not required,
plant were much like the pilot plant. Table 15.11 summarizes c. 1998, with the reactors replaced by the filtration of second-
some of the operating data for the plant, showing the effect of ary effluent.
the carbon columns in the right-hand column. As seen, the
BOD was reduced to <1mg=L with 1 COD 25 mg=L and 15.4.3.5.3 Water Factory 21
1 TOC 6mg=L. The objective was to protect the pristine 3
A 56,780 m =day (15 mgd) capacity tertiary-treatment plant
waters of Lake Tahoe.
called ‘‘Water Factory 21’’ was put on line in 1974 by the
15.4.3.5.2 Colorado Springs Tertiary Plant Orange County Water District, California (USEPA, 1973).
The tertiary plant at Colorado Springs was a joint venture The objective was to protect groundwater from seawater
between the City of Colorado Springs and the Environmental intrusion, using a line of injection wells to replenish the
Protection Agency. The plant was brought on line in 1970 aquifer. The portion of the flow diverted through the GAC
3
with a total cost of about $1 million. The plant had two reactors was 34,100 m =day (9 mgd).
circuits: (1) a 9 mgd design capacity irrigation circuit, provid- GAC Reactors: The plant was constructed with 17 carbon
ing dual media filtration, and (2) a 2.0 mgd industrial circuit columns, each 3.658 m (12 ft) diameter, with a 7.32 m (24 ft)
consisting of lime treatment, re-carbonation, filtration, and straight wall and EBCT ¼ 30 min. Each of the columns con-
3
carbon adsorption. tained (2700 ft )of8 30 mesh carbon and the hydraulic
2
3
GAC reactors: Three carbon columns of downflow type were loading at 34,100 m =day (9 mgd) was 14.2 m=h (5.8 gpm=ft )
used for the plant; two were operated in series while the third with EBCT 30 min, depending on how many columns are
column was down for regeneration. The carbon depth was operated at the same time. The columns were operated in
3048 mm (10 ft) of 8 30 mesh granular carbon in a tank parallel and the countercurrent mode of operation was used
with diameter 6096 mm (20 ft), which amounts to 186 ft 3 (alternatively, the downflow mode could be used). Carbon
GAC per column, giving EBCT 17 min=column and with could be added continuously or intermittently. For the latter
2
calculated HLR 10.4 m=h (4.24 gpm=ft ). The removals of mode of operation, the usual practice was to withdraw and
COD were 0.50 Removal 0.60 kg COD=kg carbon. The replace 5%–10% of the carbon at one time. The removal of
columns were backwashed twice a week with air and water at TOC by the GAC was about 0.7 fraction. The water flow
2
3
3
2
0.0152–0.0203 m air=min=m area (3–4ft air=min=ft area) of the reactor column was up from the bottom while the
2
and 49 m=h (20 gpm=ft ), respectively. Backwash was about flow of GAC was down in a countercurrent fashion.