
Page 607 - Fundamentals of Water Treatment Unit Processes : Physical, Chemical, and Biological
P. 607
562 Fundamentals of Water Treatment Unit Processes: Physical, Chemical, and Biological
17.6.1.2 Pilot Plant Operation 370–480 mg=L as CaCO 3 . About 0.60 fraction of homes
The parameters of operation may be measured manually, for had ion-exchange units installed to reduce hardness levels.
example, by pressure gages, sampling taps, flow, etc. or by Seven-day THMFPs have ranged 10–1000 mg=L, which
sensors placed at the needed locations, or both. For long-term added impetus to the search for adequate treatment.
operation, computer operation is most practical. For sensors, a
17.7.1.2 Brighton Pilot Plant
‘‘board’’ must be set up to take the signals (i.e., 4–20 ma) that
is then interpreted by the software to give readings and pro- A pilot plant study was initiated in October 1991 and con-
vide for archiving and plots. Valves and pumps are operated tinued through May 1992. Objectives were as following
by microrelays. (Cevaal et al., 1993): (1) determine THM precursor rejection
values, (2) confirm feed-water pressures and differential pres-
sures required, (3) assess fouling rates for each of the mem-
17.7 CASE
brane elements tested, (4) obtain data on concentrate water
The wide varieties of membrane plants in all categories, that quality relative to a discharge permit, and (5) increase public
is, MF, UF, NF, and RO, have been built and are in operation awareness and acceptance of RO. Membranes evaluated
(most are MF and RO). One case, Brighton, Colorado, is included Hydranautics 4040 LSA NCM1t, Fluid Systems
reviewed that illustrates some aspects of a design for an TFCL 4821 LPt, Filmtec BW30 4040t, and a later version
RO plant. of Hydranautics 4040 LSA NCM1t. Each membrane was a
spiral-wound polyamide thin-film composite membrane. The
polyamide thin membranes were selected over CA because of
17.7.1 CITY OF BRIGHTON REVERSE OSMOSIS WATER
their lower feed pressures and higher nitrate rejections
TREATMENT PLANT (Cevaal et al., 1993). Rejection of nitrates was about 97%
Disposal of brine is a major consideration in application of for the second and third membranes listed. Also 0.92 rejec-
RO. For that reason, interior locations, such as Brighton, tion of THMFP was achieved. Based on the pilot plant study,
Colorado, are not common. The Brighton case also illustrates the Fluid Systems TFCL membrane was selected.
the many and varied aspects of an RO design. Biological fouling was found to occur, caused by growth of
Pseudomonas. The well water showed heterotrophic plate
17.7.1.1 Background counts, 500 HPC 5000 cfu=100 mL, TOC 3mg=L,
The city of Brighton, Colorado, with a population of 14,000 and DO 6mg=L. Biological fouling was addressed in design
in 1990, is located about 35 km (22 mi) north of the north-east of the full-scale RO plant by well rehabilitation consisting of
side of Denver and about 2 km east of the South Platte River. strong acid=shock chlorine and hydrogen peroxide. Alterna-
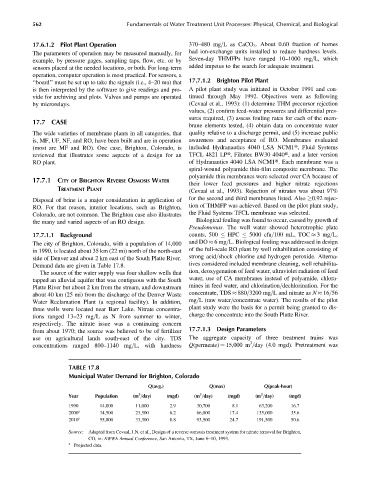
Demand data are given in Table 17.8. tives considered included membrane cleaning, well rehabilita-
The source of the water supply was four shallow wells that tion, deoxygenation of feed water, ultraviolet radiation of feed
tapped an alluvial aquifer that was contiguous with the South water, use of CA membranes instead of polyamide, chlora-
Platte River but about 2 km from the stream, and downstream mines in feed water, and chlorination=dechlorination. For the
about 40 km (25 mi) from the discharge of the Denver Waste concentrate, TDS 880=3200 mg=L and nitrate as N 16=56
Water Reclamation Plant (a regional facility). In addition, mg=L (raw water=concentrate water). The results of the pilot
three wells were located near Barr Lake. Nitrate concentra- plant study were the basis for a permit being granted to dis-
tions ranged 13–23 mg=L as N from summer to winter, charge the concentrate into the South Platte River.
respectively. The nitrate issue was a continuing concern
from about 1970; the source was believed to be of fertilizer 17.7.1.3 Design Parameters
use on agricultural lands south-east of the city. TDS The aggregate capacity of three treatment trains was
3
concentrations ranged 800–1140 mg=L, with hardness Q(permeate) ¼ 15,000 m =day (4.0 mgd). Pretreatment was
TABLE 17.8
Municipal Water Demand for Brighton, Colorado
Q(avg.) Q(max) Q(peak-hour)
3
3
3
Year Population (m =day) (mgd) (m =day) (mgd) (m =day) (mgd)
1990 14,000 11,000 2.9 30,700 8.1 63,200 16.7
2000 a 34,500 23,500 6.2 66,000 17.4 135,000 35.6
2010 a 55,000 33,300 8.8 93,500 24.7 191,500 50.6
Source: Adapted from Cevaal, J.N. et al., Design of a reverse osmosis treatment system for nitrate removal for Brighton,
CO, in: AWWA Annual Conference, San Antonio, TX, June 6–10, 1993.
a
Projected data.