
Page 605 - Fundamentals of Water Treatment Unit Processes : Physical, Chemical, and Biological
P. 605
560 Fundamentals of Water Treatment Unit Processes: Physical, Chemical, and Biological
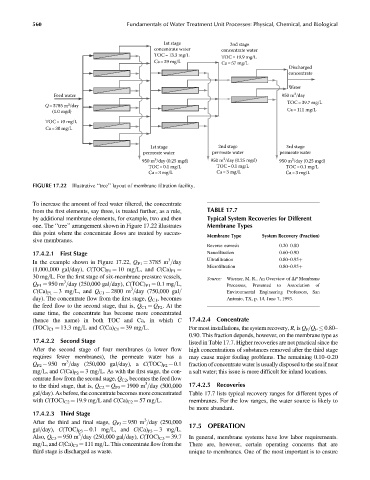
1st stage 2nd stage
concentrate water concentrate water
TOC= 13.3 mg/L TOC=19.9 mg/L
Ca =39 mg/L Ca=57 mg/L
Discharged
concentrate
Water
3
Feed water 950 m /day
TOC=39.7 mg/L
Q = 3785 m 3 /day
(1.0 mgd) Ca=111 mg/L
TOC = 10 mg/L
Ca = 30 mg/L
1st stage 2nd stage 3rd stage
permeate water permeate water permeate water
3
3
3
950 m /day (0.25 mgd) 950 m /day (0.25 mgd) 950 m /day (0.25 mgd)
TOC= 0.1 mg/L TOC=0.1 mg/L TOC=0.1 mg/L
Ca=3 mg/L Ca=3 mg/L Ca=3 mg/L
FIGURE 17.22 Illustrative ‘‘tree’’ layout of membrane filtration facility.
To increase the amount of feed water filtered, the concentrate
from the first elements, say three, is treated further, as a rule, TABLE 17.7
by additional membrane elements, for example, two and then Typical System Recoveries for Different
one. The ‘‘tree’’ arrangement shown in Figure 17.22 illustrates Membrane Types
this point where the concentrate flows are treated by succes-
Membrane Type System Recovery (Fraction)
sive membranes.
Reverse osmosis 0.20–0.80
17.4.2.1 First Stage Nanofiltration 0.60–0.90
3
In the example shown in Figure 17.22, Q F1 ¼ 3785 m =day Ultrafiltration 0.80–0.95þ
Microfiltration 0.80–0.95þ
(1,000,000 gal=day), C(TOC) F1 ¼ 10 mg=L, and C(Ca) F1 ¼
30 mg=L. For the first stage of six-membrane pressure vessels, Source: Wiesner, M. R., An Overview of DP Membrane
3
Q P1 ¼ 950 m =day (250,000 gal=day), C(TOC) P1 ¼ 0.1 mg=L, Processes, Presented to Association of
3
C(Ca) P1 ¼ 3mg=L, and Q C1 ¼ 2800 m =day (750,000 gal= Environmental Engineering Professors, San
day). The concentrate flow from the first stage, Q C1 , becomes Antonio, TX, p. 14, June 7, 1993.
the feed flow to the second stage, that is, Q C1 ¼ Q F2 . At the
same time, the concentrate has become more concentrated
(hence the name) in both TOC and Ca, in which C 17.4.2.4 Concentrate
(TOC) C1 ¼ 13.3 mg=L and C(Ca) C1 ¼ 39 mg=L. For most installations, the system recovery, R,is Q P =Q F 0.80–
0.90. This fraction depends, however, on the membrane type as
17.4.2.2 Second Stage listed in Table 17.7. Higher recoveries are not practical since the
After the second stage of four membranes (a lower flow high concentrations of substances removed after the third stage
requires fewer membranes), the permeate water has a may cause major fouling problems. The remaining 0.10–0.20
3
Q P2 ¼ 950 m =day (250,000 gal=day), a C(TOC) P2 ¼ 0.1 fraction of concentrate water is usually disposed to the sea if near
mg=L, and C(Ca) P2 ¼ 3mg=L. As with the first stage, the con- a salt water; this issue is more difficult for inland locations.
centrate flow from the second stage, Q C2 , becomes the feed flow
3
to the third stage, that is, Q C2 ¼ Q F3 ¼ 1900 m =day (500,000 17.4.2.5 Recoveries
gal=day). As before, the concentrate becomes more concentrated Table 17.7 lists typical recovery ranges for different types of
with C(TOC) C2 ¼ 19.9 mg=Land C(Ca) C2 ¼ 57 mg=L. membranes. For the low ranges, the water source is likely to
be more abundant.
17.4.2.3 Third Stage
3
After the third and final stage, Q P3 ¼ 950 m =day (250,000 17.5 OPERATION
gal=day), C(TOC) P3 ¼ 0.1 mg=L, and C(Ca) P3 ¼ 3mg=L.
3
Also, Q C3 ¼ 950 m =day (250,000 gal=day), C(TOC) C3 ¼ 39.7 In general, membrane systems have low labor requirements.
mg=L, and C(Ca) C3 ¼ 111 mg=L. This concentrate flow from the There are, however, certain operating concerns that are
third stage is discharged as waste. unique to membranes. One of the most important is to ensure