
Page 603 - Fundamentals of Water Treatment Unit Processes : Physical, Chemical, and Biological
P. 603
558 Fundamentals of Water Treatment Unit Processes: Physical, Chemical, and Biological
17.3.8.5.1 Depiction of Gel-Layer Development The wall concentration, C m , increases rapidly with
During membrane filtration, solutes are transported from the increases in permeation velocity, u, and at some point, reaches
bulk ‘‘cross-flow’’ to the surface of the membrane by advec- the ‘‘gel-concentration,’’ C g , where the solution is no longer
tive transport as a part of the permeate flow. Solutes that are a fluid. At this point, u reaches a limiting value, u(min),
rejected accumulate near the surface forming either deposits defined as,
or a gelatinous-type layer. These solutes either stay near the
surface or diffuse back into the bulk flow by Brownian motion D bl C g
u( min ) ¼ ln (17:19)
or shear-induced motion (i.e., turbulent diffusion). Figure d bl C b
17.20 illustrates these processes. The thickness of deposition
or the ‘‘gel-polarization layer’’ is established at steady state As observed by Equation 17.22, fluxes in and out of the
when the advective transport rate and back-transport rate (by boundary layer are independent of pressure. The equation is
diffusion) are equal. Equation 17.17 describes the mass bal- valid only when operating in the pressure-independent diffu-
ance between these two transport mechanisms, sion-controlled region, shown in Figure 17.20. Because C g
and C b are controlled primarily by physiochemical properties,
flux through the boundary layer can be improved only by
dC
D bl þ uC ¼ 0 (17:17) increasing the ratio (D bl =d bl ), for example, by reducing the
dx
thickness of the boundary layer, d bl , by higher cross-flow
velocity. Attempts to increase flux (such as increasing pres-
where
2 sure), however, is self-defeating as long as mechanisms are
D bl is the diffusion coefficient (m =s)
not provided to increase the rate of back diffusion into the
dC=dx is the concentration gradient over the differential
4 bulk flow (Cheryan, 1986).
element (kg=m )
u is the permeation velocity (m=s) 17.3.8.5.2 Factors That Affect Concentration
Polarization
Integration of Equation 17.22 yields:
Variables that affect the concentration polarization layer
include pressure, temperature, solute feed concentration, and
D bl C m cross-flow velocity. Figure 17.20 provides a basis for under-
ln (17:18)
u ¼
d bl C b standing how these variables relate to membrane fouling, with
special focus on the concentration polarization layer.
where
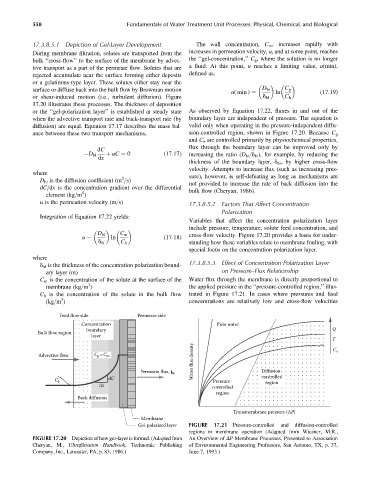
17.3.8.5.3 Effect of Concentration Polarization Layer
d bl is the thickness of the concentration polarization bound-
ary layer (m) on Pressure–Flux Relationship
C m is the concentration of the solute at the surface of the Water flux through the membrane is directly proportional to
3
membrane (kg=m ) the applied pressure in the ‘‘pressure-controlled region,’’ illus-
C b is the concentration of the solute in the bulk flow trated in Figure 17.21. In cases where pressures and feed
3
(kg=m ) concentrations are relatively low and cross-flow velocities
Feed flow side Permeate side
Concentration Pure water
boundary Q
Bulk flow region
layer
T
Water flux density
Advective flow C = C m C o
g
Permeate flux, j w Diffusion-
dC controlled
C b Pressure- region
dx
controlled
region
Back diffusion
Transmembrane pressure (ΔP)
Membrane
Gel-polarized layer FIGURE 17.21 Pressure-controlled and diffusion-controlled
regions in membrane operation (Adapted from Wiesner, M.R.,
FIGURE 17.20 Depiction of how gel-layer is formed. (Adapted from An Overview of DP Membrane Processes, Presented to Association
Cheryan, M., Ultrafiltration Handbook,Technomic Publishing of Environmental Engineering Professors, San Antonio, TX, p. 37,
Company, Inc., Lancaster, PA, p. 83, 1986.) June 7, 1993.)