
Page 599 - Fundamentals of Water Treatment Unit Processes : Physical, Chemical, and Biological
P. 599
554 Fundamentals of Water Treatment Unit Processes: Physical, Chemical, and Biological
17.3.6 OSMOSIS to right is less. As the water level rises, the water flux from left
to right increases due to the pressure differential until the two
Figure 17.15a through c, depicts a solution (left side) and pure
fluxes are equal.
water (right side) for the initial condition, the occurrence of
osmosis, and the imposition of pressure on the solution side to 17.3.6.1.1 Calculation of Osmotic Pressure
cause RO, respectively. These three figures capture, in-a-
The van’t Hoff law for dilute solutions permits calculation
nutshell, the key ideas of osmosis.
of the osmotic pressure as a function of solute concentration,
17.3.6.1 Osmotic Pressure that is,
Osmosis is a natural phenomenon that occurs when two
p ¼ C B RT (17:15)
solutions having different solute concentrations come in con-
tact with a semipermeable membrane, that is, a membrane
where
permeable only to water. To explain in more detail, Figure
p is the osmotic pressure (kPa)
17.15a depicts the initial condition when the solution is placed 3
C B is the concentration of solute ‘‘B’’ (mol=m )
on the left side of the membrane and pure water is placed on
R is the universal gas constant (8.314510 N-m=g-mol K)
the right side. Figure 17.15b depicts the water flow from the
T is the temperature of solution (K)
pure water side to the solution side. The water level on the
solution side will rise to a point equivalent to the osmotic
The van’t Hoff relation may be derived starting with an
pressure, p, of the concentrated solution. This is the osmosis
equilibrium statement that equates the partial molar free
process.
energy of the pure water solution with the water in solution
When the water level rises on the solution side such that
(see, e.g., Mulder, 1991, p. 201). The equation gives a rea-
the osmotic pressure is achieved, the water fluxes in both
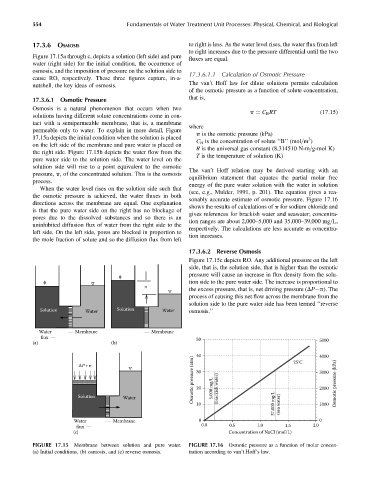
sonably accurate estimate of osmotic pressure. Figure 17.16
directions across the membrane are equal. One explanation
shows the results of calculations of p for sodium chloride and
is that the pure water side on the right has no blockage of
gives references for brackish water and seawater; concentra-
pores due to the dissolved substances and so there is an
tion ranges are about 2,000–5,000 and 35,000–39,000 mg=L,
uninhibited diffusion flux of water from the right side to the
respectively. The calculations are less accurate as concentra-
left side. On the left side, pores are blocked in proportion to
tion increases.
the mole fraction of solute and so the diffusion flux from left
17.3.6.2 Reverse Osmosis
Figure 17.15c depicts RO. Any additional pressure on the left
side, that is, the solution side, that is higher than the osmotic
pressure will cause an increase in flux density from the solu-
tion side to the pure water side. The increase is proportional to
π
the excess pressure, that is, net driving pressure (DP p). The
process of causing this net flow across the membrane from the
solution side to the pure water side has been termed ‘‘reverse
Solution Water Solution Water osmosis.’’
Water Membrane Membrane
flux 50 5000
(a) (b)
40 4000
Osmotic pressure (atm) 20 (brackish water) 2000 Osmotic pressure (kPa)
ΔP+π 30 25°C 3000
Solution Water 10 5,000 mg/L 37,000 mg/L (sea water) 1000
Water Membrane 0 0
0.0 0.5 1.0 1.5 2.0
flux
(c) Concentration of NaCl (mol/L)
FIGURE 17.15 Membrane between solution and pure water. FIGURE 17.16 Osmotic pressure as a function of molar concen-
(a) Initial conditions, (b) osmosis, and (c) reverse osmosis. tration according to van’t Hoff’s law.