
Page 833 - Fundamentals of Water Treatment Unit Processes : Physical, Chemical, and Biological
P. 833
788 Appendix C: Miscellaneous Relations
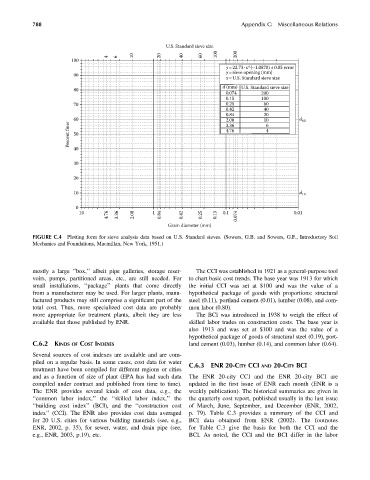
U.S. Standard sieve size
4 6 10 20 40 60 100 200
100
y =22.73 x^(–1.0878)± 0.05 error
y =sieve opening (mm)
90
x =U.S. Standard sieve size
d (mm) U.S. Standard sieve size
80
0.074 200
0.15 100
70 0.25 60
0.42 40
0.84 20
60 2.00 10 6 d 60
Percent finer 50 4.76 4
3.36
40
30
20
10 d 10
0
4.76 3.36 2.00 0.84 0.42 0.25 0.15 0.074
10 1 0.1 0.01
Grain diameter (mm)
FIGURE C.4 Plotting form for sieve analysis data based on U.S. Standard sieves. (Sowers, G.B. and Sowers, G.F., Introductory Soil
Mechanics and Foundations, Macmillan, New York, 1951.)
mostly a large ‘‘box,’’ albeit pipe galleries, storage reser- The CCI was established in 1921 as a general-purpose tool
voirs, pumps, partitioned areas, etc., are still needed. For to chart basic cost trends. The base year was 1913 for which
small installations, ‘‘package’’ plants that come directly the initial CCI was set at $100 and was the value of a
from a manufacturer may be used. For larger plants, manu- hypothetical package of goods with proportions: structural
factured products may still comprise a significant part of the steel (0.11), portland cement (0.01), lumber (0.08), and com-
total cost. Thus, more specialized cost data are probably mon labor (0.80).
more appropriate for treatment plants, albeit they are less The BCI was introduced in 1938 to weigh the effect of
available that those published by ENR. skilled labor trades on construction costs. The base year is
also 1913 and was set at $100 and was the value of a
hypothetical package of goods of structural steel (0.19), port-
C.6.2 KINDS OF COST INDEXES land cement (0.03), lumber (0.14), and common labor (0.64).
Several sources of cost indexes are available and are com-
piled on a regular basis. In some cases, cost data for water C.6.3 ENR 20-CITY CCI AND 20-CITY BCI
treatment have been compiled for different regions or cities
and as a function of size of plant (EPA has had such data The ENR 20-city CCI and the ENR 20-city BCI are
compiled under contract and published from time to time). updated in the first issue of ENR each month (ENR is a
The ENR provides several kinds of cost data, e.g., the weekly publication). The historical summaries are given in
‘‘common labor index,’’ the ‘‘skilled labor index,’’ the the quarterly cost report, published usually in the last issue
‘‘building cost index’’ (BCI), and the ‘‘construction cost of March, June, September, and December (ENR, 2002,
index’’ (CCI). The ENR also provides cost data averaged p. 79). Table C.3 provides a summary of the CCI and
for 20 U.S. cities for various building materials (see, e.g., BCI data obtained from ENR (2002). The footnotes
ENR, 2002, p. 35), for sewer, water, and drain pipe (see, for Table C.3 give the basis for both the CCI and the
e.g., ENR, 2003, p.19), etc. BCI. As noted, the CCI and the BCI differ in the labor