
Page 837 - Fundamentals of Water Treatment Unit Processes : Physical, Chemical, and Biological
P. 837
792 Appendix D: Fluid Mechanics—Reviews of Selected Topics
force and fluid velocity. The fluid may be air, water, oil, D is the diameter of pipe (m)
v is the velocity of fluid in pipe (m=s)
alcohol, etc. The kind of fluid used does not affect the C D
2
versus R relationship. g is the acceleration of gravity (m=s )
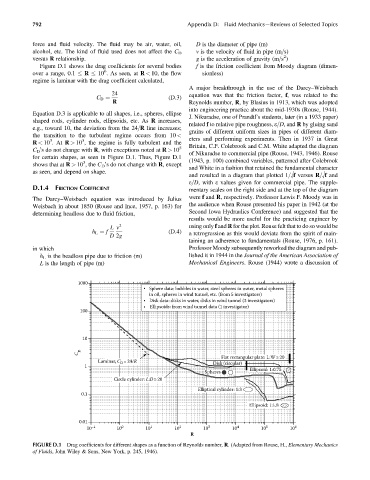
Figure D.1 shows the drag coefficients for several bodies f is the friction coefficient from Moody diagram (dimen-
6
over a range, 0.1 R 10 . As seen, at R < 10, the flow sionless)
regime is laminar with the drag coefficient calculated,
A major breakthrough in the use of the Darcy–Weisbach
24 equation was that the friction factor, f, was related to the
(D:3)
C D ¼
Reynolds number, R, by Blasius in 1913, which was adopted
R
into engineering practice about the mid-1930s (Rouse, 1944).
Equation D.3 is applicable to all shapes, i.e., spheres, ellipse
J. Nikuradse, one of Prandtl’s students, later (in a 1933 paper)
shaped rods, cylinder rods, ellipsoids, etc. As R increases,
related f to relative pipe roughness, e=D, and R by gluing sand
e.g., toward 10, the deviation from the 24=R line increases; grains of different uniform sizes in pipes of different diam-
the transition to the turbulent regime occurs from 10 <
3 3 eters and performing experiments. Then in 1937 in Great
R < 10 .At R > 10 , the regime is fully turbulent and the
5 Britain, C.F. Colebrook and C.M. White adapted the diagram
C D ’s do not change with R, with exceptions noted at R > 10
of Nikuradse to commercial pipe (Rouse, 1943, 1946). Rouse
for certain shapes, as seen in Figure D.1. Thus, Figure D.1
3 (1943, p. 100) combined variables, patterned after Colebrook
shows that at R > 10 , the C D ’s do not change with R, except
and White in a fashion that retained the fundamental character
as seen, and depend on shape.
and resulted in a diagram that plotted 1=!f versus R=!f and
e=D, with e values given for commercial pipe. The supple-
D.1.4 FRICTION COEFFICIENT mentary scales on the right side and at the top of the diagram
The Darcy–Weisbach equation was introduced by Julius were f and R, respectively. Professor Lewis F. Moody was in
Weisbach in about 1850 (Rouse and Ince, 1957, p. 163) for the audience when Rouse presented his paper in 1942 (at the
determining headloss due to fluid friction, Second Iowa Hydraulics Conference) and suggested that the
results would be more useful for the practicing engineer by
L v 2 using only f and R for the plot. Rouse felt that to do so would be
h L ¼ f (D:4)
D 2g a retrogression as this would deviate from the spirit of main-
taining an adherence to fundamentals (Rouse, 1976, p. 161).
in which Professor Moody subsequently reworked the diagram and pub-
h L is the headloss pipe due to friction (m) lished it in 1944 in the Journal of the American Association of
L is the length of pipe (m) Mechanical Engineers. Rouse (1944) wrote a discussion of
1000
Sphere data: bubbles in water, steel spheres in water, metal spheres
in oil, spheres in wind tunnel, etc. (from 5 investigators)
Disk data: disks in water, disks in wind tunnel (3 investigators)
Ellipsoids: from wind tunnel data (1 investigator)
100
10
C D
Flat rectangular plate: L:W≥20
Laminar, C = 24/R Disk (circular)
D
1
Ellipsoid: 1:0.75
Spheres
Circle cylinder: L:D≥20
Elliptical cylinder: 1:3
0.1
Ellipsoid: 1:1.8
0.01
10 –1 10 0 10 1 10 2 10 3 10 4 10 5 10 6
R
FIGURE D.1 Drag coefficients for different shapes as a function of Reynolds number, R. (Adapted from Rouse, H., Elementary Mechanics
of Fluids, John Wiley & Sons, New York, p. 245, 1946).