
Page 834 - Fundamentals of Water Treatment Unit Processes : Physical, Chemical, and Biological
P. 834
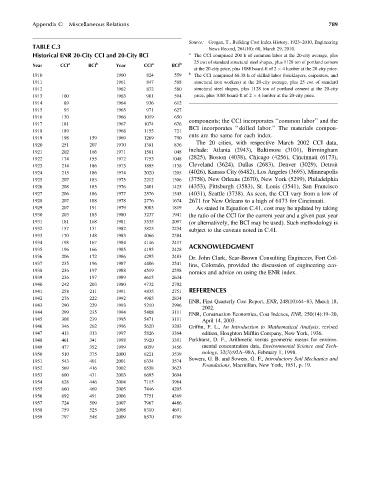
Appendix C: Miscellaneous Relations                                                              789


                                                               Source: Grogan, T., Building Cost Index History, 1923–2010, Engineering
            TABLE C.3                                                 News Record, 264(10): 60, March 29, 2010.
            Historical ENR 20-City CCI and 20-City BCI         a  The CCI comprised 200 h of common labor at the 20-city average, plus
                                                                 25 cwt of standard structural steel shapes, plus 1128 ton of portland cement
            Year     CCI a    BCI b    Year     CCI a     BCI b
                                                                 at the 20-city price, plus 1088 board-ft of 2   4 lumber at the 20-city price.
            1910                       1960      824      559  b  The CCI comprised 68.38 h of skilled labor (bricklayers, carpenters, and
            1911                       1961      847      568    structural iron workers) at the 20-city average, plus 25 cwt of standard
            1912                       1962      872      580    structural steel shapes, plus 1128 ton of portland cement at the 20-city
            1913     100               1963      901      594    price, plus 1088 board-ft of 2   4 lumber at the 20-city price.
            1914      89               1964      936      612
            1915      93               1965      971      627
            1916     130               1966     1019      650
                                                               components; the CCI incorporates ‘‘common labor’’ and the
            1917     181               1967     1074      676
                                                               BCI incorporates ‘‘skilled labor.’’ The materials compon-
            1918     189               1968     1155      721
                                                               ents are the same for each index.
            1919     198       159     1969     1269      790
                                                                  The 20 cities, with respective March 2002 CCI data,
            1920     251       207     1970     1381      836
                                                               include: Atlanta (2943), Baltimore (3101), Birmingham
            1921     202       166     1971     1581      048
            1922     174       155     1972     1753      1048  (2825), Boston (4038), Chicago (4256), Cincinnati (6173),
            1923     214       186     1973     1895      1138  Cleveland (3624), Dallas (2683), Denver (3029), Detroit
            1924     215       186     1974     2020      1205  (4026), Kansas City (6482), Los Angeles (3695), Minneapolis
            1925     207       183     1975     2212      1306  (3758), New Orleans (2670), New York (5299), Philadelphia
            1926     208       185     1976     2401      1425  (4353), Pittsburgh (3583), St. Louis (3541), San Francisco
            1927     206       186     1977     2576      1545  (4031), Seattle (3738). As seen, the CCI vary from a low of
            1928     207       188     1978     2776      1674  2671 for New Orleans to a high of 6173 for Cincinnati.
            1929     207       191     1979     3003      1819    As stated in Equation C.41, cost may be updated by taking
            1930     203       185     1980     3237      1941  the ratio of the CCI for the current year and a given past year
            1931     181       168     1981     3535      2097  (or alternatively, the BCI may be used). Such methodology is
            1932     157       131     1982     3825      2234  subject to the caveats noted in C.41.
            1933     170       148     1983     4066      2384
            1934     198       167     1984     4146      2417
                                                               ACKNOWLEDGMENT
            1935     196       166     1985     4195      2428
            1936     206       172     1986     4295      2483  Dr. John Clark, Sear-Brown Consulting Engineers, Fort Col-
            1937     235       196     1987     4406      2541
                                                               lins, Colorado, provided the discussion of engineering eco-
            1938     236       197     1988     4519      2598
                                                               nomics and advice on using the ENR index.
            1939     236       197     1989     4615      2634
            1940     242       203     1980     4732      2702
            1941     258       211     1991     4835      2751  REFERENCES
            1942     276       222     1992     4985      2834
                                                               ENR, First Quarterly Cost Report, ENR, 248(10):64–83, March 18,
            1943     290       229     1993     5210      2996
                                                                    2002.
            1944     299       235     1994     5408      3111  ENR, Construction Economics, Cost Indexes, ENR, 250(14):19–20,
            1945     308       239     1995     5471      3111      April 14, 2003.
            1946     346       262     1996     5620      3203  Griffin, F. L., An Introduction to Mathematical Analysis, revised
            1947     413       313     1997     5826      3364      edition, Houghton Mifflin Company, New York, 1936.
            1948     461       341     1998     5920      3391  Parkhurst, D. F., Arithmetic versus geometric means for environ-
            1949     477       352     1999     6059      3456      mental concentration data, Environmental Science and Tech-
            1950     510       375     2000     6221      3539      nology, 32(3):92A–98A, February 1, 1998.
                                                               Sowers, G. B. and Sowers, G. F., Introductory Soil Mechanics and
            1951     543       401     2001     6334      3574
                                                                    Foundations, Macmillan, New York, 1951, p. 19.
            1952     569       416     2002     6538      3623
            1953     600       431     2003     6695      3694
            1954     628       446     2004     7115      3984
            1955     660       469     2005     7446      4205
            1956     692       491     2006     7751      4369
            1957     724       509     2007     7967      4486
            1958     759       525     2008     8310      4691
            1959     797       548     2009     8570      4769