
Page 869 - Fundamentals of Water Treatment Unit Processes : Physical, Chemical, and Biological
P. 869
824 Appendix E: Porous Media Hydraulics
6.0 10 –9
Sand-S
Anthracite-A
5.0 10 –9 Glass beads - GB A-d = 1.71 mm
10
4.0 10 –9
k (m 2 ) 3.0 10 –9 S-d = 1.50 mm A-d = 1.47 mm
10
GB-d = 1.50 mm 10
10
2.0 10 –9
A-d = 1.02 mm
10
= 1.08 mm
S-d 10
1.0 10 –9
S-d = 0.47 mm
0.0 10
0.30 0.35 0.40 0.45 0.50 0.55 0.60
Porosity
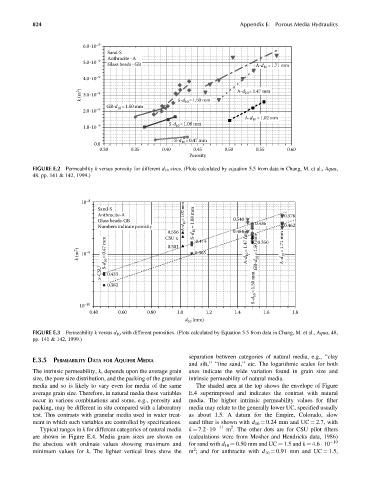
FIGURE E.2 Permeability k versus porosity for different d 10 sizes. (Plots calculated by equation 5.5 from data in Chang, M. et al., Aqua,
48, pp. 141 & 142, 1999.)
10 –8
Sand-S
Anthracite-A A-d 10 = 1.02 mm 0.576
Glass beads-GB S-d 10 = 1.08 mm 0.540 0.436
Numbers indicate porosity 0.462
0.556 0.414 0.484 0.350
CSU x
k (m 2 ) 10 –9 S-d 10 = 0.47 mm 0.501 0.365 A-d 10 = 1.47 mm A-d 10 = 1.71 mm
x-CSU 0.433 S-d 10 =1.50 mm GB-d 10 = 1.50 mm
0.382
10 –10
0.40 0.60 0.80 1.0 1.2 1.4 1.6 1.8
d 10 (mm)
FIGURE E.3 Permeability k versus d 10 with different porosities. (Plots calculated by Equation 5.5 from data in Chang, M. et al., Aqua, 48,
pp. 141 & 142, 1999.)
separation between categories of natural media, e.g., ‘‘clay
E.3.5 PERMEABILITY DATA FOR AQUIFER MEDIA
and silt,’’ ‘‘fine sand,’’ etc. The logarithmic scales for both
The intrinsic permeability, k, depends upon the average grain axes indicate the wide variation found in grain size and
size, the pore size distribution, and the packing of the granular intrinsic permeability of natural media.
media and so is likely to vary even for media of the same The shaded area at the top shows the envelope of Figure
average grain size. Therefore, in natural media these variables E.4 superimposed and indicates the contrast with natural
occur in various combinations and some, e.g., porosity and media. The higher intrinsic permeability values for filter
packing, may be different in situ compared with a laboratory media may relate to the generally lower UC, specified usually
test. This contrasts with granular media used in water treat- as about 1.5. A datum for the Empire, Colorado, slow
ment in which such variables are controlled by specifications. sand filter is shown with d 10 ¼ 0.24 mm and UC ¼ 2.7, with
2
Typical ranges in k for different categories of natural media k ¼ 7.2 10 11 m . The other dots are for CSU pilot filters
are shown in Figure E.4. Media grain sizes are shown on (calculations were from Mosher and Hendricks data, 1986)
the abscissa with ordinate values showing maximum and for sand with d 10 ¼ 0.50 mm and UC ¼ 1.5 and k ¼ 4.6 10 10
2
minimum values for k. The lighter vertical lines show the m ; and for anthracite with d 10 ¼ 0.91 mm and UC ¼ 1.5,