
Page 871 - Fundamentals of Water Treatment Unit Processes : Physical, Chemical, and Biological
P. 871
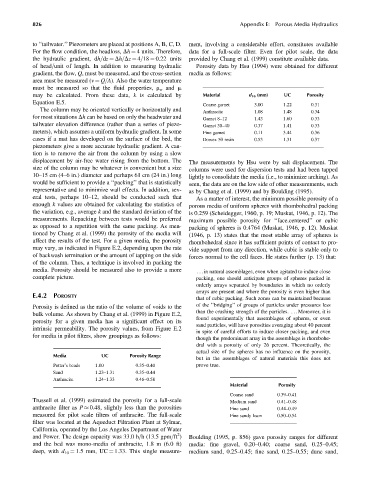
826                                                                 Appendix E:  Porous Media Hydraulics


            to ‘‘tailwater.’’ Piezometers are placed at positions A, B, C, D.  ment, involving a considerable effort, constitutes available
            For the flow condition, the headloss, Dh ¼ 4 units. Therefore,  data for a full-scale filter. Even for pilot scale, the data
            the hydraulic gradient, dh=dz ¼ Dh=Dz ¼ 4=18 ¼ 0.22 units  provided by Chang et al. (1999) constitute available data.
            of head=unit of length. In addition to measuring hydraulic  Porosity data by Hsu (1994) were obtained for different
            gradient, the flow, Q, must be measured, and the cross-section  media as follows:
            area must be measured (v ¼ Q=A). Also the water temperature
            must be measured so that the fluid properties, r w and m
            may be calculated. From these data, k is calculated by  Material       d 10 (mm)  UC      Porosity
            Equation E.5.
                                                                    Coarse garnet    3.00     1.22     0.31
              The column may be oriented vertically or horizontally and
                                                                    Anthracite       1.08     1.48     0.34
            for most situations Dh can be based on only the headwater and  Garnet 8–12  1.43  1.60     0.33
            tailwater elevation difference (rather than a series of piezo-  Garnet 30–40  0.37  1.41   0.33
            meters), which assumes a uniform hydraulic gradient. In some  Fine garnet  0.11   3.44     0.36
            cases if a mat has developed on the surface of the bed, the  Dowex 50 resin  0.53  1.31    0.37
            piezometers give a more accurate hydraulic gradient. A cau-
            tion is to remove the air from the column by using a slow
            displacement by air-free water rising from the bottom. The  The measurements by Hsu were by salt displacement. The
            size of the column may be whatever is convenient but a size  columns were used for dispersion tests and had been tapped
            10–15 cm (4–6 in.) diameter and perhaps 61 cm (24 in.) long  lightly to consolidate the media (i.e., to minimize arching). As
            would be sufficient to provide a ‘‘packing’’ that is statistically  seen, the data are on the low side of other measurements, such
            representative and to minimize wall effects. In addition, sev-  as by Chang et al. (1999) and by Boulding (1995).
            eral tests, perhaps 10–12, should be conducted such that  As a matter of interest, the minimum possible porosity of a
            enough k values are obtained for calculating the statistics of  porous media of uniform spheres with rhombohedral packing
            the variation, e.g., average k and the standard deviation of the  is 0.259 (Scheidegger, 1960, p. 19; Muskat, 1946, p. 12). The
            measurements. Repacking between tests would be preferred  maximum possible porosity for ‘‘face.centered’’ or cubic
            as opposed to a repetition with the same packing. As men-  packing of spheres is 0.4764 (Muskat, 1946, p. 12). Muskat
            tioned by Chang et al. (1999) the porosity of the media will  (1946, p. 13) states that the most stable array of spheres is
            affect the results of the test. For a given media, the porosity  rhombohedral since it has sufficient points of contact to pro-
            may vary, as indicated in Figure E.2, depending upon the rate  vide support from any direction, while cubic is stable only to
            of backwash termination or the amount of tapping on the side  forces normal to the cell faces. He states further (p. 13) that:
            of the column. Thus, a technique is involved in packing the
            media. Porosity should be measured also to provide a more  ...in natural assemblages, even when agitated to induce close
            complete picture.                                     packing, one should anticipate groups of spheres packed in
                                                                  orderly arrays separated by boundaries in which no orderly
                                                                  arrays are present and where the porosity is even higher than
            E.4.2 POROSITY
                                                                  that of cubic packing. Such zones can be maintained because
            Porosity is defined as the ratio of the volume of voids to the  of the ‘‘bridging’’ of groups of particles under pressures less
            bulk volume. As shown by Chang et al. (1999) in Figure E.2,  than the crushing strength of the particles. . . . Moreover, it is
                                                                  found experimentally that assemblages of spheres, or even
            porosity for a given media has a significant effect on its
                                                                  sand particles, will have porosities averaging about 40 percent
            intrinsic permeability. The porosity values, from Figure E.2
                                                                  in spite of careful efforts to induce closer packing, and even
            for media in pilot filters, show groupings as follows:
                                                                  though the predominant array in the assemblage is rhombohe-
                                                                  dral with a porosity of only 26 percent. Theoretically, the
                                                                  actual size of the spheres has no influence on the porosity,
                   Media          UC        Porosity Range
                                                                  but in the assemblages of natural materials this does not
                   Potter’s beads  1.00       0.35–0.40           prove true.
                   Sand         1.23–1.31     0.35–0.44
                   Anthracite   1.24–1.33     0.46–0.58
                                                                             Material        Porosity
                                                                             Coarse sand    0.39–0.41
            Trussell et al. (1999) estimated the porosity for a full-scale   Medium sand    0.41–0.48
            anthracite filter as P   0.48, slightly less than the porosities  Fine sand      0.44–0.49
            measured for pilot scale filters of anthracite. The full-scale    Fine sandy loam  0.50–0.54
            filter was located at the Aqueduct Filtration Plant at Sylmar,
            California, operated by the Los Angeles Department of Water
                                                           2
            and Power. The design capacity was 33.0 h=h (13.5 gpm=ft )  Boulding (1995, p. 856) gave porosity ranges for different
            and the bed was mono-media of anthracite, 1.8 m (6.0 ft)  media: fine gravel, 0.20–0.40; coarse sand, 0.25–0.45;
            deep, with d 10 ¼ 1.5 mm, UC ¼ 1.33. This single measure-  medium sand, 0.25–0.45; fine sand, 0.25–0.55; dune sand,