
Page 870 - Fundamentals of Water Treatment Unit Processes : Physical, Chemical, and Biological
P. 870
Appendix E: Porous Media Hydraulics 825
10 –8
CSU
10 –9 Filter media
CSU
Natural media
10 –10
Empire SS
k (m 2 ) Max
10 –11
Min
10 –12 Very coarse sand
Clay and slit Very fine sand Fine sand Medium sand Coarse sand Gravel
10 –13
0.01 0.1 1 10
d (mm)
50
FIGURE E.4 Intrinsic permeabilities, k, for different average grain sizes and categories of granular media. (Adapted from Boulding, J.R.,
Practical Handbook of Soil, Vadose Zone, and Ground-Water Contamination—Assessment Prevention, and Remediation, Lewis Publishers,
Ann Arbor, MI, 1995, p. 869; filter data calculated from Chang, M. et al., Aqua, 48, pp. 141 & 142, 1999.)
9 2
and k ¼ 2.4 10 m . The headloss data were obtained from E.4.1 PERMEABILITY TEST
piezometers at 10 cm spacing. The slow sand data were for the
Always, for critical work, a laboratory test is preferred to
whole bed (two beds in the filter) and the flow was not
determine the intrinsic permeability of a given media. Such
measured but judged based on the design flow capacity of
the filter. a test involves a careful protocol which is summarized here
conceptually. The basic idea of the test is to measure the
hydraulic gradient through the media along with the HLR,
E.4 TESTS
i.e., v or 204, and then calculate K and then k (temperature
Intrinsic permeability and porosity are two important vari- being measured also).
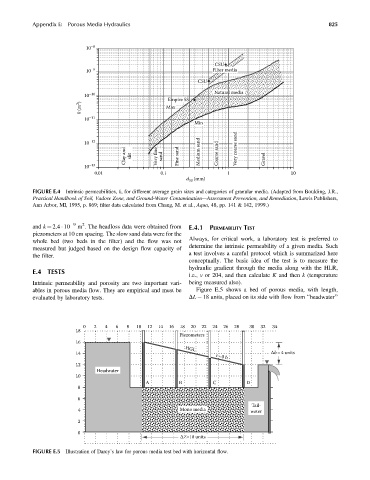
ables in porous media flow. They are empirical and must be Figure E.5 shows a bed of porous media, with length,
evaluated by laboratory tests. DL ¼ 18 units, placed on its side with flow from ‘‘headwater’’
0 2 4 6 8 10 12 14 16 18 20 22 24 26 28 30 32 34
18
Piezometers
16
HGL
14 Δh=4 units
t=0 h
12
Headwater
10
A B C D
8
6
Tail-
4 Mono media water
2
0
ΔZ=18 units
FIGURE E.5 Illustration of Darcy’s law for porous media test bed with horizontal flow.