Page 904 - Fundamentals of Water Treatment Unit Processes : Physical, Chemical, and Biological
P. 904

Appendix H:  Dissolved Gases                                                                     859


            H.2.5  EFFECT OF TEMPERATURE ON HENRY’S            DH =R data in Table H.4. The units for H i in the temperature

                                                                  i
                                                               regression equation, Equation H.53 are [atm gas i   m 3
                   LAW CONSTANT
                                                               H 2 O=mol dissolved gas i].
            A single Henry’s constant at some given temperature is, as a
            rule, not adequate knowledge, since temperature has a strong
                                                                  Example H.7 Calculation of DH from Table H.4
                                                                                             D
            effect. The temperature dependence of Henry’s constant is                        i
            given by the van’t Hoff relation,
                                                                  Consider again, chloroform, i.e., CHCl 3 , which shows ln
                                                                  A CHCl3 ¼ 11.41, and DH =R ¼ 5030.

                                                                                    i
                                         DH
                               D            i
                               i
                            ln H ¼ ln A i              (H:13)
                                          RT                        1. Substituting data in a modification of Equation
                                                                      H.14,
            where

              DH is the standard state enthalpy change due to dissol-                        DH   =R
                                                                                              i

                 i                                                                 H ¼ e  ln A i    T
                                                                                    D
                ution of component i in water (J=mol i)                             i
                                                           1
              R is the universal gas constant (8.314 510 cal mol   1  K )        D           5030
                                                                                H    ¼ e ð 11:41   298 Þ
              T is the absolute temperature (K)                                  CHCl 3
                                                                                                         3
              A i is the constant for gas i (dimensionless)                                   atm CHCl 3   m H 2 O
                                                                                     ¼ 0:00451
                                                                                                  mol CHCl 3
              In other words,
                                                                  Comments
                                                                  This compares with 0.0041 in Yaws (1999, p. 407), and
                                       DH   =R
                                        i
                               D
                             H ¼ A i e     T           (H:14)     with 0.0042, 0.0038 from Ashworth et al. (1988). Convert-
                              i                                         S
                                                                  ing to H  gives,
                                                                        CHCl 3
                                                                                        mg CHCl =LH 2 O
            H.2.5.1  Illustration of Temperature Effect                   H S  ¼ 26 469        3
                                                                           CHCl 3         atm CHCl 3
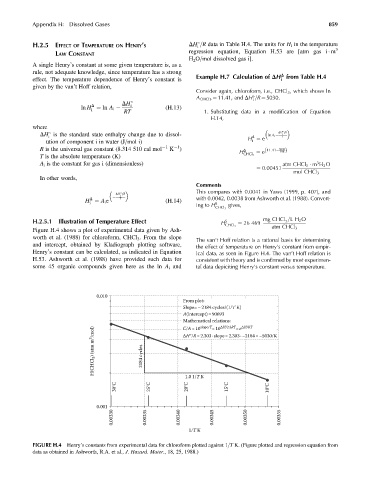
            Figure H.4 shows a plot of experimental data given by Ash-
            worth et al. (1988) for chloroform, CHCl 3 . From the slope
                                                                  The van’t Hoff relation is a rational basis for determining
            and intercept, obtained by Kladiograph plotting software,  the effect of temperature on Henry’s constant from empir-
            Henry’s constant can be calculated, as indicated in Equation  ical data, as seen in Figure H.4. The van’tHoff relation is
            H.53. Ashworth et al. (1988) have provided such data for  consistent with theory and is confirmed by most experimen-
            some 45 organic compounds given here as the ln A i and  tal data depiciting Henry’s constant versus temperature.
                                 0.010
                                                             From plot:
                                                             Slope=–2184 cycles/(1/T K)
                                                             A(intercept)=90693
                                                             Mathematical relations:  =e ΔH/RT
                                                                   slope/T
                                                                          ΔH/2.3RT
                                                             C/A=10
                                                                       =10
                                H(CHCl 3 ) (atm m 3 /mol)  2184 cycles  ΔH°/R=2.303 · slope=2.303 · –2184=–5030/K
                                                              1.0 1/T K
                                       30°C       25°C         20°C         15°C         10°C


                                 0.001
                                      0.00330    0.00335    0.00340    0.00345    0.00350    0.00355


                                                               1/T K

            FIGURE H.4  Henry’s constants from experimental data for chloroform plotted against 1=T K. (Figure plotted and regression equation from
            data as obtained in Ashworth, R.A. et al., J. Hazard. Mater., 18, 25, 1988.)
   899   900   901   902   903   904   905   906   907   908   909