
Page 126 - Gas Purification 5E
P. 126
1 16 Gas PiiriJication
ings of 0.15 to 0.2 mole C02 per mole amine (0.16 to 0.18 preferred); and a fmal rich solu-
tion loading of 0.45 to 0.55 moldmole. Under these conditions, the absorber requires 3 to 4
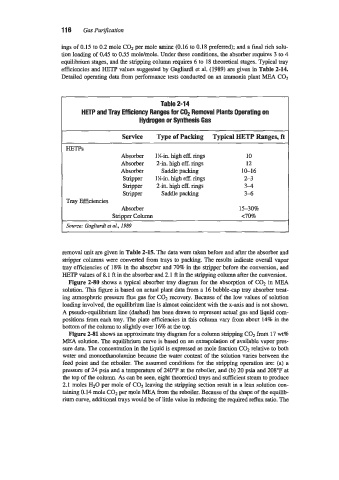
equilibrium stages, and the stripping column requires 6 to 18 theoretical stages. Typical tray
efficiencies and HETP values suggested by Gagliardi et al. (1989) are given in Table 2-11.
Detailed operating data from performance tests conducted on an ammonia plant MEA COz
Table 2-14
HETP and Tray Efficiency Ranges for C02 Removal Plants Operating on
Hydrogen or Synthesis Gas
Service Type of Packing Typical HETP Ranges, ft
HETPs
Absorber 1 %in. high eff. rings 10
Absorber 2-in. high eff. rings 12
Absorber Saddle packing 10-16
Stripper 1%-in. high eff. rings 2-3
Stripper 2-in. high eff. rings 34
stripper Saddle packing 3-6
Tray Efficiencies
Absorber 15-308
stripper Column ~70%
Source: Gagliardi et al., 1989
removal unit are given in Table 2-15. The data were taken before and after the absorber and
stripper columns were converted from trays to packing. The results indicate overall vapor
tray efficiencies of 18% in the absorber and 708 in the stripper before the conversion, and
HETP values of 8.1 ft in the absorber and 2.1 ft in the stripping column after the conversion.
Figure 2-80 shows a typical absorber tray diagram for the absorption of C02 in MEA
solution. This figure is based on actual plant data from a 16 bubble-cap tray absorber treat-
ing atmospheric pressure flue gas for COz recovery. Because of the low values of solution
loading involved, the equilibrium line is almost coincident with the x-axis and is not shown.
A pseudo-equilibrium line (dashed) has been drawn to represent actual gas and liquid com-
from about 14% in the
positions from each tray. The plate efficiencies in this column v q 7
bottom of the column to slightly over 16% at the top.
Figure 2-81 shows an approximate tray diagram for a column stripping COz from 17 wt%
MEA solution. The equilibrium curve is based on an extrapolation of available vapor pres-
sure data. The concentration in the liquid is expressed as mole fraction COz relative to both
water and monoethanolamine because the water content of the solution varies between the
feed point and the reboiler. The assumed conditions for the stripping operation are: (a) a
pressure of 24 psia and a temperature of 240°F at the reboiler, and (b) 20 psia and 208°F at
the top of the column. As can be seen, eight theoretical trays and sufficient steam to produce
2.1 moles HzO per mole of C02 leaving the stripping section result in a lean solution con-
taining 0.14 mole COz per mole MEA from the reboiler. Because of the shape of the equilib-
rium curve, additional trays would be of little value in reducing the required reflux ratio. The