
Page 161 - Gas Purification 5E
P. 161
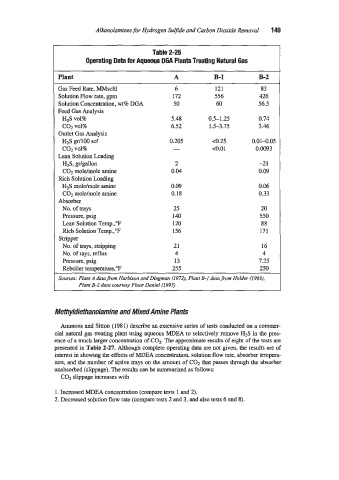
Ahnolamines for Hvdrogen Supde and Carbon Dioxide Renzoval   149


                                              Table 2-25
                           Operating Data for Aqueous DGA Plants Treating Natural Gas


                  Plant                              A           B-1          E2
                                          ~~                  ~~             ~
                  Gas Feed Rate. MMscfd              6           121           83
                  Solution Flow rate, gpm           172          556          426
                  Solution Concentration, wt8 DGA    50          60           56.5
                  Feed Gas Analysis
                    HZS  ~019                       5.48       0.5-1.25       0.74
                    co-, vol8                       6.52       1.5-3.75       3.46
                  Outlet Gas Analysis
                    HZS @/lo0 scf                  0.205        4.25        0.01-0.05
                    cop VOlTi                        -          <0.01        0.0093
                  Lean Solution Loading
                    H2S. gdgallon                    2                        -2 1
                    COz mole/mole amine             0.04                      0.09
                  Rich Solution Loading
                    H2S mole/mole amine             0.09                      0.06
                    C02 mole/mole amine             0.18                      0.33
                  Absorber
                    No. of trays                     25                        20
                    Pressure, psig                  140                       550
                    Lean Solution Temp.,"F          120                        88
                    Rich Solution Temp.,"F          156                       171
                   Shipper
                    No. of trays, shipping           21                        16
                    No. of rays, reflux              4                         4
                    Pressure, psig                   13                       7.25
                    Reboiler temperature,"F         255                       250
                  Soirees: Plant -4 data from Harbison and Dingman (1972j, Plant B-I  data from Holder (19661,
                        Plant B-2 data courtesy Fluor Daniel (1995)


                    ethyl diet ha no la mine and Mixed Amine Plants

                   Ammons and Sitton (1981) describe an extensive series of tests conducted on a commer-
                 cial natural gas treating plant using aqueous MDEA to selectively remove H,S  in the pres-
                 ence of a much larger concentration of C02 The approximate results of eight of the tests are
                 presented in Table 2-27.  Although complete operating data are not given, the results are of
                 interest in showing the effects of MDEA concentration, solution flow rate, absorber tempera-
                 ture, and the number of active trays on the amount of C02 that passes through the absorber
                 unabsorbed (slippage). The results can be summarized as follows:
                   COz slippage increases with

                 1. Increased MDEA concentration (compare tests 1 and 2).
                 2. Decreased solution flow rate (compare tests 2 and 3? and also tests 6 and 8).