
Page 41 - Geochemical Anomaly and Mineral Prospectivity Mapping in GIS
P. 41
Spatial Data Models, Management and Operations 37
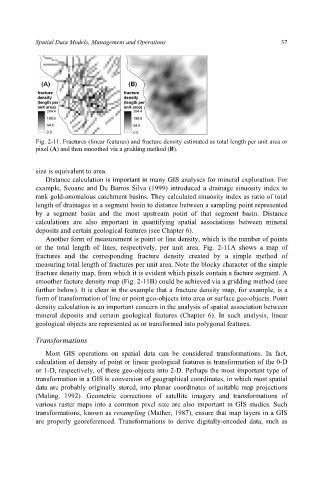
Fig. 2-11. Fractures (linear features) and fracture density estimated as total length per unit area or
pixel (A) and then smoothed via a gridding method (B).
size is equivalent to area.
Distance calculation is important in many GIS analyses for mineral exploration. For
example, Seoane and De Barros Silva (1999) introduced a drainage sinuosity index to
rank gold-anomalous catchment basins. They calculated sinuosity index as ratio of total
length of drainages in a segment basin to distance between a sampling point represented
by a segment basin and the most upstream point of that segment basin. Distance
calculations are also important in quantifying spatial associations between mineral
deposits and certain geological features (see Chapter 6).
Another form of measurement is point or line density, which is the number of points
or the total length of lines, respectively, per unit area. Fig. 2-11A shows a map of
fractures and the corresponding fracture density created by a simple method of
measuring total length of fractures per unit area. Note the blocky character of the simple
fracture density map, from which it is evident which pixels contain a facture segment. A
smoother facture density map (Fig. 2-11B) could be achieved via a gridding method (see
further below). It is clear in the example that a fracture density map, for example, is a
form of transformation of line or point geo-objects into area or surface geo-objects. Point
density calculation is an important concern in the analysis of spatial association between
mineral deposits and certain geological features (Chapter 6). In such analysis, linear
geological objects are represented as or transformed into polygonal features.
Transformations
Most GIS operations on spatial data can be considered transformations. In fact,
calculation of density of point or linear geological features is transformation of the 0-D
or 1-D, respectively, of these geo-objects into 2-D. Perhaps the most important type of
transformation in a GIS is conversion of geographical coordinates, in which most spatial
data are probably originally stored, into planar coordinates of suitable map projections
(Maling, 1992). Geometric corrections of satellite imagery and transformations of
various raster maps into a common pixel size are also important in GIS studies. Such
transformations, known as resampling (Mather, 1987), ensure that map layers in a GIS
are properly georeferenced. Transformations to derive digitally-encoded data, such as