
Page 40 - Geochemical Anomaly and Mineral Prospectivity Mapping in GIS
P. 40
36 Chapter 2
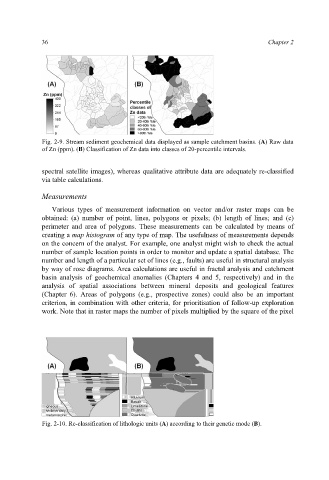
Fig. 2-9. Stream sediment geochemical data displayed as sample catchment basins. (A) Raw data
of Zn (ppm). (B) Classification of Zn data into classes of 20-percentile intervals.
spectral satellite images), whereas qualitative attribute data are adequately re-classified
via table calculations.
Measurements
Various types of measurement information on vector and/or raster maps can be
obtained: (a) number of point, lines, polygons or pixels; (b) length of lines; and (c)
perimeter and area of polygons. These measurements can be calculated by means of
creating a map histogram of any type of map. The usefulness of measurements depends
on the concern of the analyst. For example, one analyst might wish to check the actual
number of sample location points in order to monitor and update a spatial database. The
number and length of a particular set of lines (e.g., faults) are useful in structural analysis
by way of rose diagrams. Area calculations are useful in fractal analysis and catchment
basin analysis of geochemical anomalies (Chapters 4 and 5, respectively) and in the
analysis of spatial associations between mineral deposits and geological features
(Chapter 6). Areas of polygons (e.g., prospective zones) could also be an important
criterion, in combination with other criteria, for prioritisation of follow-up exploration
work. Note that in raster maps the number of pixels multiplied by the square of the pixel
Fig. 2-10. Re-classification of lithologic units (A) according to their genetic mode (B).