
Page 198 - Geochemical Remote Sensing of The Sub-Surface
P. 198
Light hydrocarbons for petroleum and gas prospecting 175
ml aliquot of the headspace is sampled using a locking gas-tight syringe. The sample is
then hand injected into a gas chromatograph equipped with a flame ionisation detector
for analysis of the disaggregated gases. It is assumed that these gases represent micopore
gas, some free gas and lightly adsorbed gas on the sample-medium surface.
This technique (or modifications of it) has been used in the analysis of well cuttings
and deep sea cores (Hunt and Whelan, 1979), in addition to surface geochemical
prospecting (Richers et al., 1986; Richers and Weatherby, 1985).
Initial tests of this method were conducted at Gulf Research and Development
Company for comparison with the auger hole technique and to gain a better
understanding of the relationship between free gas and adsorbed gases liberated by the
drilling process. To be an effective and viable technique, the disaggregation desorption
method must be able to distinguish between oily and gassy areas. An area known to be
predominantly oily, Rose Hill in Lee County, Virginia, and another known to be
predominantly gassy, the Gulf Research Facility in Pittsburgh, Pennsylvania, were
chosen as initial test sites. Both areas had been sampled previously using the auger hole
technique, allowing the new data to be compared with the established data sets (Richers,
1984).
The Rose Hill test site includes 126 soil cores of which 51 fall within 300 m (1,000
feet) of the earlier auger holes. Despite differences in the sample locations and depths,
both techniques correctly identify the area as oil-prone. Table 5-XII shows the
relationship between the diagnostic gas ratios (Jones and Drozd, 1983) and the results of
the two surveys (Richers, 1984). It is obvious that the ball-mill technique accurately
describes the oil-prone nature of the Rose Hill oil field. However, the data of Table 5-
XII suggest a slight difference in the composition of the hydrocarbons detected by the
two techniques. In the auger holes the soil gas is slightly drier (methane-rich) than the
soil gas obtained by ball-mill disaggregation-desorption. This shift may reflect the
preferential loss of methane from the shallow cores compared to the deeper auger holes
and the difference between core samples and free gas measurements. The other gases are
essentially the same in both techniques: the C4/nC4 ratio for the disaggregation technique
is 0.34, and the auger hole technique yields a value of 0.40; the C2/C 3 ratios are
comparable at 1.84 for the disaggregation technique and 1.76 for the auger hole
technique. In addition, the intercorrelation of the various hydrocarbon gases in the
disaggregation data set is higher than that for the auger hole data. This high degree of
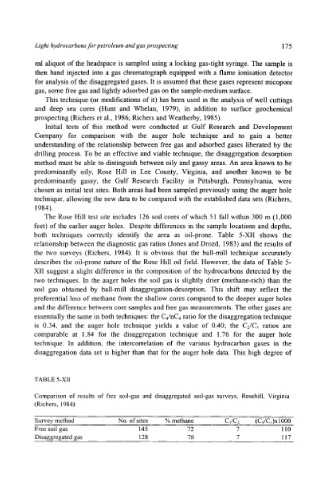
TABLE 5-XII
Comparison of results of free soil-gas and disaggregated soil-gas surveys, Rosehill, Virginia
(Richers, 1984)
Survey method No. of sites % methane CI/C 2 (C3/Ci)x 1000
Free soil gas 145 72 7 110
Disaggregated gas 128 70 7 117