
Page 194 - Geochemical Remote Sensing of The Sub-Surface
P. 194
Light hydrocarbons for petroleum and gas prospecting 171
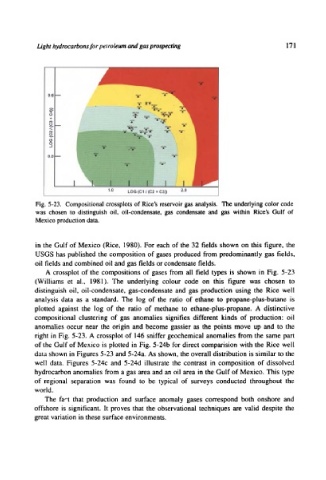
Fig. 5-23. Compositional crossplots of Rice's reservoir gas analysis. The underlying color code
was chosen to distinguish oil, oil-condensate, gas condensate and gas within Rice's Gulf of
Mexico production data.
in the Gulf of Mexico (Rice, 1980). For each of the 32 fields shown on this figure, the
USGS has published the composition of gases produced from predominantly gas fields,
oil fields and combined oil and gas fields or condensate fields.
A crossplot of the compositions of gases from all field types is shown in Fig. 5-23
(Williams et al., 1981). The underlying colour code on this figure was chosen to
distinguish oil, oil-condensate, gas-condensate and gas production using the Rice well
analysis data as a standard. The log of the ratio of ethane to propane-plus-butane is
plotted against the log of the ratio of methane to ethane-plus-propane. A distinctive
compositional clustering of gas anomalies signifies different kinds of production: oil
anomalies occur near the origin and become gassier as the points move up and to the
right in Fig. 5-23. A crossplot of 146 sniffer geochemical anomalies from the same part
of the Gulf of Mexico is plotted in Fig. 5-24b for direct comparision with the Rice well
data shown in Figures 5-23 and 5-24a. As shown, the overall distribution is similar to the
well data. Figures 5-24c and 5-24d illustrate the contrast in composition of dissolved
hydrocarbon anomalies from a gas area and an oil area in the Gulf of Mexico. This type
of regional separation was found to be typical of surveys conducted throughout the
world.
The fa'-t that production and surface anomaly gases correspond both onshore and
offshore is significant. It proves that the observational techniques are valid despite the
great variation in these surface environments.