
Page 189 - Geochemical Remote Sensing of The Sub-Surface
P. 189
166 V.T. Jones, M.D. Matthews and D.M. Richers
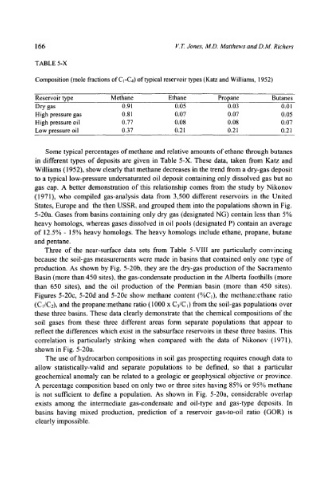
TABLE 5-X
Composition (mole fractions of C1-C4) of typical reservoir types (Katz and Williams, 1952)
Reservoir type Methane Ethane Propane Butanes
Dry gas 0.91 0.05 0.03 0.01
High pressure gas 0.81 0.07 0.07 0.05
High pressure oil 0.77 0.08 0.08 0.07
Low pressure oil 0.37 0.21 0.21 0.21
Some typical percentages of methane and relative amounts of ethane through butanes
in different types of deposits are given in Table 5-X. These data, taken from Katz and
Williams (1952), show clearly that methane decreases in the trend from a dry-gas deposit
to a typical low-pressure undersaturated oil deposit containing only dissolved gas but no
gas cap. A better demonstration of this relationship comes from the study by Nikonov
(1971), who compiled gas-analysis data from 3,500 different reservoirs in the United
States, Europe and the then USSR, and grouped them into the populations shown in Fig.
5-20a. Gases from basins containing only dry gas (designated NG) contain less than 5%
heavy homologs, whereas gases dissolved in oil pools (designated P) contain an average
of 12.5% - 15% heavy homologs. The heavy homologs include ethane, propane, butane
and pentane.
Three of the near-surface data sets from Table 5-VIII are particularly convincing
because the soil-gas measurements were made in basins that contained only one type of
production. As shown by Fig. 5-20b, they are the dry-gas production of the Sacramento
Basin (more than 450 sites), the gas-condensate production in the Alberta foothills (more
than 650 sites), and the oil production of the Permian basin (more than 450 sites).
Figures 5-20c, 5-20d and 5-20e show methane content (%C~), the methane:ethane ratio
(C~/C2), and the propane:methane ratio (1000 x C3/C~) from the soil-gas populations over
these three basins. These data clearly demonstrate that the chemical compositions of the
soil gases from these three different areas form separate populations that appear to
reflect the differences which exist in the subsurface reservoirs in these three basins. This
correlation is particularly striking when compared with the data of Nikonov (1971),
shown in Fig. 5-20a.
The use of hydrocarbon compositions in soil gas prospecting requires enough data to
allow statistically-valid and separate populations to be defined, so that a particular
geochemical anomaly can be related to a geologic or geophysical objective or province.
A percentage composition based on only two or three sites having 85% or 95% methane
is not sufficient to define a population. As shown in Fig. 5-20a, considerable overlap
exists among the intermediate gas-condensate and oil-type and gas-type deposits. In
basins having mixed production, prediction of a reservoir gas-to-oil ratio (GOR) is
clearly impossible.