
Page 190 - Geochemical Remote Sensing of The Sub-Surface
P. 190
Light hydrocarbons for petroleum and gas prospecting 167
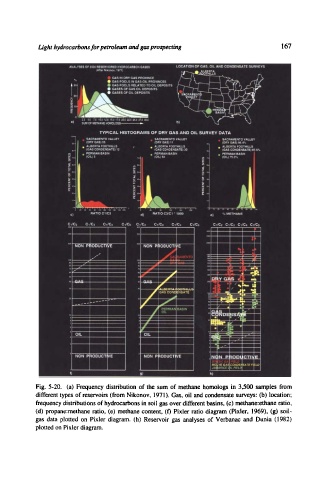
Fig. 5-20. (a) Frequency distribution of the sum of methane homologs in 3,500 samples from
different types of reservoirs (from Nikonov, 1971). Gas, oil and condensate surveys: (b) location;
frequency distributions of hydrocarbons in soil gas over different basins, (r methane:ethane ratio,
(d) propane:methane ratio, (e) methane content, (f) Pixler ratio diagram (Pixler, 1969), (g) soil-
gas data plotted on Pixler diagram. (h) Reservoir gas analyses of Verbanac and Dunia (1982)
plotted on Pixler diagram.