
Page 145 - Geothermal Energy Renewable Energy and The Environment
P. 145
Resource Assessments 131
Probability Probability
0 1 2 3 4 5 6 7 8 9 10 80 120 140 160 180 200 220 240 260 280 300
3
Reservoir volume (km ) Reservoir temperature (°C)
Q = ρ CV (T –T )
0
R
R
Probability R = Q WH /Q R
R
Monte carlo simulations
of
energy to turbine/generator
0.08 0.10 0.12 0.14 0.16 0.18 0.20
Recovery factor
Median
95 5
Mode
Probability Mean
0.0 2.0 4.0 6.0 8.0 10.0
Megawatts
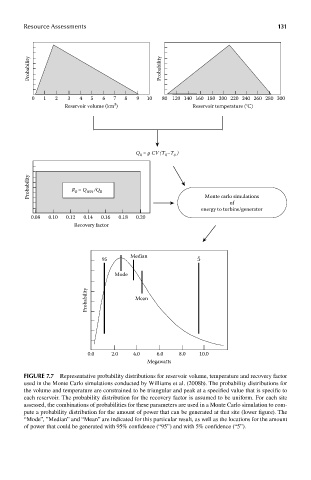
FIGUre 7.7 Representative probability distributions for reservoir volume, temperature and recovery factor
used in the Monte Carlo simulations conducted by Williams et al. (2008b). The probability distributions for
the volume and temperature are constrained to be triangular and peak at a specified value that is specific to
each reservoir. The probability distribution for the recovery factor is assumed to be uniform. For each site
assessed, the combinations of probabilities for these parameters are used in a Monte Carlo simulation to com-
pute a probability distribution for the amount of power that can be generated at that site (lower figure). The
“Mode”, ”Median” and “Mean” are indicated for this particular result, as well as the locations for the amount
of power that could be generated with 95% confidence (“95”) and with 5% confidence (“5”).