
Page 144 - Geothermal Energy Renewable Energy and The Environment
P. 144
130 Geothermal Energy: Renewable Energy and the Environment
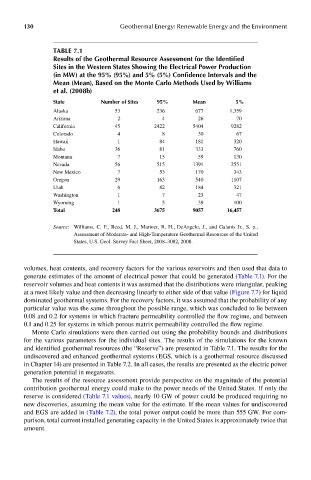
Table 7.1
results of the Geothermal resource assessment for the Identified
sites in the western states showing the electrical power production
(in mw) at the 95% (95%) and 5% (5%) confidence Intervals and the
mean (mean), based on the monte carlo methods Used by williams
et al. (2008b)
state number of sites 95% mean 5%
Alaska 53 236 677 1,359
Arizona 2 4 26 70
California 45 2422 5404 9282
Colorado 4 8 30 67
Hawaii 1 84 181 320
Idaho 36 81 333 760
Montana 7 15 59 130
Nevada 56 515 1391 2551
New Mexico 7 53 170 343
Oregon 29 163 540 1107
Utah 6 82 184 321
Washington 1 7 23 47
Wyoming 1 5 39 100
Total 2.4.8. 3.6.7.5. 9.0.5.7. 16.,4.5.7.
Source: Williams, C. F., Reed, M. J., Mariner, R. H., DeAngelo, J., and Galanis Jr., S. p.,
Assessment of Moderate- and High-Temperature Geothermal Resources of the United
States, U.S. Geol. Survey Fact Sheet, 2008–3082, 2008.
volumes, heat contents, and recovery factors for the various reservoirs and then used that data to
generate estimates of the amount of electrical power that could be generated (Table 7.1). For the
reservoir volumes and heat contents it was assumed that the distributions were triangular, peaking
at a most likely value and then decreasing linearly to either side of that value (Figure 7.7) for liquid
dominated geothermal systems. For the recovery factors, it was assumed that the probability of any
particular value was the same throughout the possible range, which was concluded to lie between
0.08 and 0.2 for systems in which fracture permeability controlled the flow regime, and between
0.1 and 0.25 for systems in which porous matrix permeability controlled the flow regime.
Monte Carlo simulations were then carried out using the probability bounds and distributions
for the various parameters for the individual sites. The results of the simulations for the known
and identified geothermal resources (the “Reserve”) are presented in Table 7.1. The results for the
undiscovered and enhanced geothermal systems (EGS, which is a geothermal resource discussed
in Chapter 14) are presented in Table 7.2. In all cases, the results are presented as the electric power
generation potential in megawatts.
The results of the resource assessment provide perspective on the magnitude of the potential
contribution geothermal energy could make to the power needs of the United States. If only the
reserve is considered (Table 7.1 values), nearly 10 GW of power could be produced requiring no
new discoveries, assuming the mean value for the estimate. If the mean values for undiscovered
and EGS are added in (Table 7.2), the total power output could be more than 555 GW. For com-
parison, total current installed generating capacity in the United States is approximately twice that
amount.