
Page 143 - Geothermal Energy Renewable Energy and The Environment
P. 143
Resource Assessments 129
case sTUdy: esTablIshInG The UnITed sTaTes
GeoThermal resoUrce
Once the heat content and recovery factors have been delineated for specific geothermal reservoirs,
as well as the probability distribution associated with them, it is possible to undertake the final part
of the resource assessment. This involves calculating the most likely values and their respective
ranges for the reservoirs. For undiscovered resources, estimates are developed using the approach
described above in which certain geological settings are given a probability of containing certain
types of geothermal resources, based on historical experience and production histories. Once these
are delineated, the heat contents and recovery factors are similarly estimated.
The resulting database is then used to compute a probability distribution for the geothermal resource.
Various statistical approaches can be used to do this. One common method that has been successful in
the oil and gas community is the Monte Carlo technique as employed by the U.S. Geological Survey
(Charpentier and Klett 2007). The most recent results for geothermal reservoirs that have been derived
using this approach are those published by the U.S. Geological Survey in its recent assessment of the
geothermal resources of the western United States (Williams et al. 2008b).
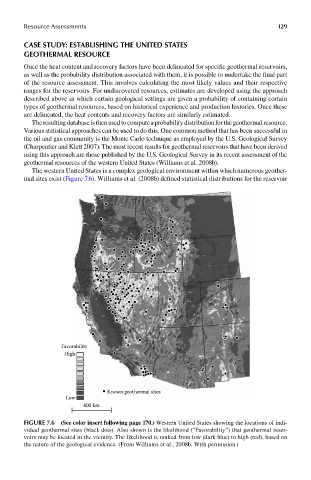
The western United States is a complex geological environment within which numerous geother-
mal sites exist (Figure 7.6). Williams et al. (2008b) defined statistical distributions for the reservoir
Favorability
High
Known geothermal sites
Low
400 km
FIGUre 7.6 (See color insert following page 17.0..) Western United States showing the locations of indi-
vidual geothermal sites (black dots). Also shown is the likelihood (“Favorability”) that geothermal reser-
voirs may be located in the vicinity. The likelihood is ranked from low (dark blue) to high (red), based on
the nature of the geological evidence. (From Williams et al., 2008b. With permission.)