
Page 208 - Geothermal Energy Renewable Energy and The Environment
P. 208
Low Temperature Geothermal Resources: Ground Source Heat Pumps 195
50,000
GSHP online
45,000
40,000
Total $
35,000
30,000
25,000
1999 2000 2001 2002 2003 2004 2005 2006
Year
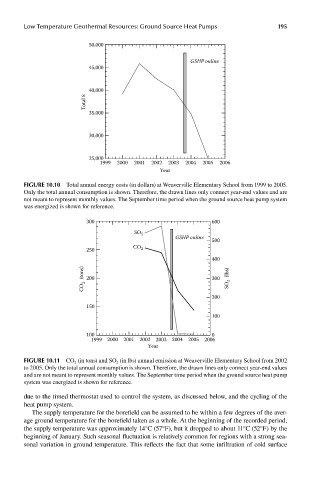
FIGUre 10.10 Total annual energy costs (in dollars) at Weaverville Elementary School from 1999 to 2005.
Only the total annual consumption is shown. Therefore, the drawn lines only connect year-end values and are
not meant to represent monthly values. The September time period when the ground source heat pump system
was energized is shown for reference.
300 600
SO 2
GSHP online 500
CO
250 2
400
CO 2 (tons) 200 300 SO 2 (lbs)
200
150
100
100 0
1999 2000 2001 2002 2003 2004 2005 2006
Year
FIGUre 10.11 CO 2 (in tons) and SO 2 (in lbs) annual emission at Weaverville Elementary School from 2002
to 2005. Only the total annual consumption is shown. Therefore, the drawn lines only connect year-end values
and are not meant to represent monthly values. The September time period when the ground source heat pump
system was energized is shown for reference.
due to the timed thermostat used to control the system, as discussed below, and the cycling of the
heat pump system.
The supply temperature for the borefield can be assumed to be within a few degrees of the aver-
age ground temperature for the borefield taken as a whole. At the beginning of the recorded period,
the supply temperature was approximately 14°C (57°F), but it dropped to about 11°C (52°F) by the
beginning of January. Such seasonal fluctuation is relatively common for regions with a strong sea-
sonal variation in ground temperature. This reflects the fact that some infiltration of cold surface