
Page 209 - Geothermal Energy Renewable Energy and The Environment
P. 209
196 Geothermal Energy: Renewable Energy and the Environment
70
Return from room heat pump
Borefield supply
65
Return to borefield
60
55
T °F
50
45
40
35
0 500 1000 1500
Time (Hrs.)
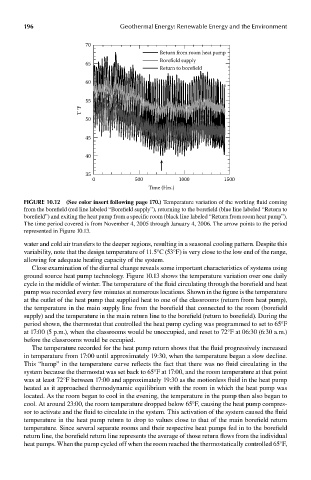
FIGUre 10.12 (See color insert following page 17.0..) Temperature variation of the working fluid coming
from the borefield (red line labeled “Borefield supply”), returning to the borefield (blue line labeled “Return to
borefield”) and exiting the heat pump from a specific room (black line labeled “Return from room heat pump”).
The time period covered is from November 4, 2005 through January 4, 2006. The arrow points to the period
represented in Figure 10.13.
water and cold air transfers to the deeper regions, resulting in a seasonal cooling pattern. Despite this
variability, note that the design temperature of 11.5°C (53°F) is very close to the low end of the range,
allowing for adequate heating capacity of the system.
Close examination of the diurnal change reveals some important characteristics of systems using
ground source heat pump technology. Figure 10.13 shows the temperature variation over one daily
cycle in the middle of winter. The temperature of the fluid circulating through the borefield and heat
pump was recorded every few minutes at numerous locations. Shown in the figure is the temperature
at the outlet of the heat pump that supplied heat to one of the classrooms (return from heat pump),
the temperature in the main supply line from the borefield that connected to the room (borefield
supply) and the temperature in the main return line to the borefield (return to borefield). During the
period shown, the thermostat that controlled the heat pump cycling was programmed to set to 65°F
at 17:00 (5 p.m.), when the classrooms would be unoccupied, and reset to 72°F at 06:30 (6:30 a.m.)
before the classrooms would be occupied.
The temperature recorded for the heat pump return shows that the fluid progressively increased
in temperature from 17:00 until approximately 19:30, when the temperature began a slow decline.
This “hump” in the temperature curve reflects the fact that there was no fluid circulating in the
system because the thermostat was set back to 65°F at 17:00, and the room temperature at that point
was at least 72°F between 17:00 and approximately 19:30 as the motionless fluid in the heat pump
heated as it approached thermodynamic equilibrium with the room in which the heat pump was
located. As the room began to cool in the evening, the temperature in the pump then also began to
cool. At around 23:00, the room temperature dropped below 65°F, causing the heat pump compres-
sor to activate and the fluid to circulate in the system. This activation of the system caused the fluid
temperature in the heat pump return to drop to values close to that of the main borefield return
temperature. Since several separate rooms and their respective heat pumps fed in to the borefield
return line, the borefield return line represents the average of those return flows from the individual
heat pumps. When the pump cycled off when the room reached the thermostatically controlled 65°F,