
Page 207 - Geothermal Energy Renewable Energy and The Environment
P. 207
194 Geothermal Energy: Renewable Energy and the Environment
50,000
GSHP online
40,000
Propane
30,000
Liters
20,000
Oil
10,000
0
1999 2000 2001 2002 2003 2004 2005 2006
Year
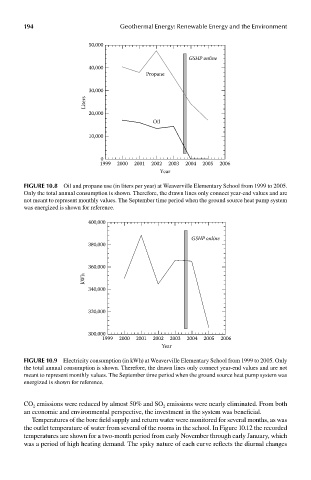
FIGUre 10.8 Oil and propane use (in liters per year) at Weaverville Elementary School from 1999 to 2005.
Only the total annual consumption is shown. Therefore, the drawn lines only connect year-end values and are
not meant to represent monthly values. The September time period when the ground source heat pump system
was energized is shown for reference.
400,000
GSHP online
380,000
360,000
kWh
340,000
320,000
300,000
1999 2000 2001 2002 2003 2004 2005 2006
Year
FIGUre 10.9 Electricity consumption (in kWh) at Weaverville Elementary School from 1999 to 2005. Only
the total annual consumption is shown. Therefore, the drawn lines only connect year-end values and are not
meant to represent monthly values. The September time period when the ground source heat pump system was
energized is shown for reference.
CO emissions were reduced by almost 50% and SO emissions were nearly eliminated. From both
2
2
an economic and environmental perspective, the investment in the system was beneficial.
Temperatures of the bore field supply and return water were monitored for several months, as was
the outlet temperature of water from several of the rooms in the school. In Figure 10.12 the recorded
temperatures are shown for a two-month period from early November through early January, which
was a period of high heating demand. The spiky nature of each curve reflects the diurnal changes