
Page 210 - Geothermal Energy Renewable Energy and The Environment
P. 210
Low Temperature Geothermal Resources: Ground Source Heat Pumps 197
65
Return from room heat pump
60
Borefield supply
55
T °F 50
45
40 Return to borefield
35
17:00 22:00 03:00 08:00 13:00 18:00
Time (Hrs.)
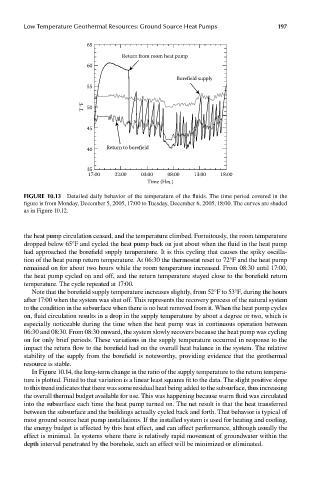
FIGUre 10.13 Detailed daily behavior of the temperature of the fluids. The time period covered in the
figure is from Monday, December 5, 2005, 17:00 to Tuesday, December 6, 2005, 18:00. The curves are shaded
as in Figure 10.12.
the heat pump circulation ceased, and the temperature climbed. Fortuitously, the room temperature
dropped below 65°F and cycled the heat pump back on just about when the fluid in the heat pump
had approached the borefield supply temperature. It is this cycling that causes the spiky oscilla-
tion of the heat pump return temperature. At 06:30 the thermostat reset to 72°F and the heat pump
remained on for about two hours while the room temperature increased. From 08:30 until 17:00,
the heat pump cycled on and off, and the return temperature stayed close to the borefield return
temperature. The cycle repeated at 17:00.
Note that the borefield supply temperature increases slightly, from 52°F to 53°F, during the hours
after 17:00 when the system was shut off. This represents the recovery process of the natural system
to the condition in the subsurface when there is no heat removed from it. When the heat pump cycles
on, fluid circulation results in a drop in the supply temperature by about a degree or two, which is
especially noticeable during the time when the heat pump was in continuous operation between
06:30 and 08:30. From 08:30 onward, the system slowly recovers because the heat pump was cycling
on for only brief periods. These variations in the supply temperature occurred in response to the
impact the return flow to the borefield had on the overall heat balance in the system. The relative
stability of the supply from the borefield is noteworthy, providing evidence that the geothermal
resource is stable.
In Figure 10.14, the long-term change in the ratio of the supply temperature to the return tempera-
ture is plotted. Fitted to that variation is a linear least squares fit to the data. The slight positive slope
to this trend indicates that there was some residual heat being added to the subsurface, thus increasing
the overall thermal budget available for use. This was happening because warm fluid was circulated
into the subsurface each time the heat pump turned on. The net result is that the heat transferred
between the subsurface and the buildings actually cycled back and forth. That behavior is typical of
most ground source heat pump installations. If the installed system is used for heating and cooling,
the energy budget is affected by this heat effect, and can affect performance, although usually the
effect is minimal. In systems where there is relatively rapid movement of groundwater within the
depth interval penetrated by the borehole, such an effect will be minimized or eliminated.