
Page 171 - Global Tectonics
P. 171
CONTINENTAL RIFTS AND RIFTED MARGINS 157
(a) 0° 30°
30°
(b)
36∞
36∞ 40° 42° 44° 38° 39° 40° 41°
0° 11° 11°
Red
14∞
14 ∞ Sea 14°
-30°
10° Ankober 10°
12° 12° BF
Gulf A Angelele MS
of
Afar Aden Addis
Depression Ababa
10° 10° 9° Ambo Fault A' 9°
Ethiopian Fentale-
Plateau Boset- Dofen
MS
Kone
MS
Arboye BF
8° Southeastern 8°
Plateau Guraghe BF Asella-Sire BF
Fig. 7.4b 8° 8°
Earthquake Aluto-Gedemsa MS Earthquake
Magnitude Magnitude
6° 6°
2 3 4 5 6
1 2 3 4
7° 7°
36° 38° 40° 42° 44°
38° 39° 40° 41°
m m
0 Elevation 5000 1000 2000 3000 4000
(c) Elevation
38° 39° 40° 41°
(d)
Red A 39.6° A'
Sea e i
B rift 0 NW Magmatic segment SE
10° 10° 5
Depth (km) 10
MER 15
20
A 0 20 40 60 80
9° 9° Distance (km)
40°
KEY
<2 Ma faults
A' Eruptive centers
8° e 8°
way
mid-Miocene–
Pliocene border
faults
B'
7° 7°
38° 39° 40° 41°
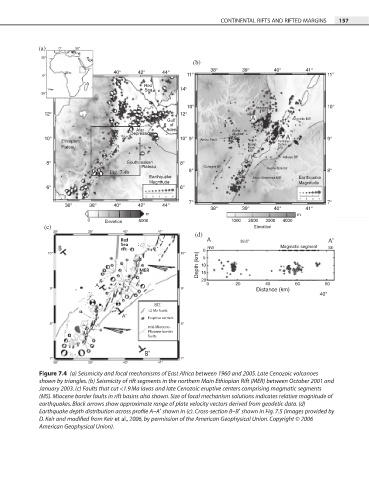
Figure 7.4 (a) Seismicity and focal mechanisms of East Africa between 1960 and 2005. Late Cenozoic volcanoes
shown by triangles. (b) Seismicity of rift segments in the northern Main Ethiopian Rift (MER) between October 2001 and
January 2003. (c) Faults that cut <1.9 Ma lavas and late Cenozoic eruptive centers comprising magmatic segments
(MS). Miocene border faults in rift basins also shown. Size of focal mechanism solutions indicates relative magnitude of
earthquakes. Black arrows show approximate range of plate velocity vectors derived from geodetic data. (d)
Earthquake depth distribution across profile A–A′ shown in (c). Cross-section B–B′ shown in Fig. 7.5 (images provided by
D. Keir and modified from Keir et al., 2006, by permission of the American Geophysical Union. Copyright © 2006
American Geophysical Union).