
Page 175 - Global Tectonics
P. 175
CONTINENTAL RIFTS AND RIFTED MARGINS 161
-1.5 -0.8 0 0.8 1.5 -2 -1 0 1 2
(a) 75 km P-wave % velocity anomaly (b) 75 km S-wave % velocity anomaly
B
10.0 10.0
A B'
9.0 Latitude 9.0 Latitude
8.0 8.0
A'
37° E 38 39 40 41 42 37° E 38 39 40 41 42
Longitude Longitude
B
(c) A' 0 (d) B' 0
A
100 100
Depth (km)
200 200 Depth (km)
300
300
400
( 9° N, 37° E ) ( 7° N, 41° E ) 400
( 10.25° N, 38° E ) ( 9° N, 42° E )
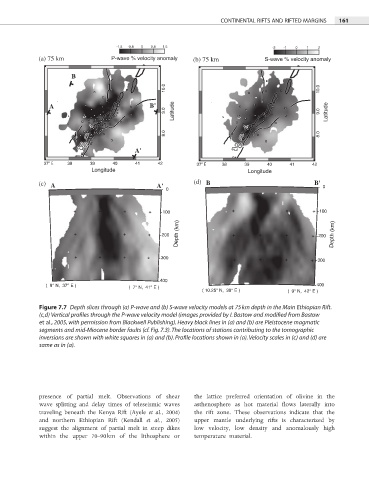
Figure 7.7 Depth slices through (a) P-wave and (b) S-wave velocity models at 75 km depth in the Main Ethiopian Rift.
(c,d) Vertical profiles through the P-wave velocity model (images provided by I. Bastow and modified from Bastow
et al., 2005, with permission from Blackwell Publishing). Heavy black lines in (a) and (b) are Pleistocene magmatic
segments and mid-Miocene border faults (cf. Fig. 7.3). The locations of stations contributing to the tomographic
inversions are shown with white squares in (a) and (b). Profile locations shown in (a). Velocity scales in (c) and (d) are
same as in (a).
presence of partial melt. Observations of shear the lattice preferred orientation of olivine in the
wave splitting and delay times of teleseismic waves asthenosphere as hot material flows laterally into
traveling beneath the Kenya Rift (Ayele et al., 2004) the rift zone. These observations indicate that the
and northern Ethiopian Rift (Kendall et al., 2005) upper mantle underlying rifts is characterized by
suggest the alignment of partial melt in steep dikes low velocity, low density and anomalously high
within the upper 70–90 km of the lithosphere or temperature material.